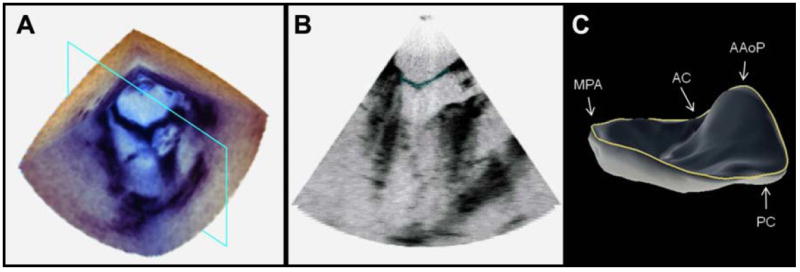
Figure 1.

3DE image of the mitral valve. (a) The 3DE image volume of the mitral valve at mid systole. (b) A cross section of the 3DE image with the automated segmentation of the mitral leaflets shown in red. (c) The fitted deformable model of the mitral leaflets with the 3D annular contour shown in blue. (AAoP = anterior aortic peak of the annulus, MPA = midpoint of the posterior annulus, AC = anterior commissure, PC = posterior commissure)
