Figure 3.

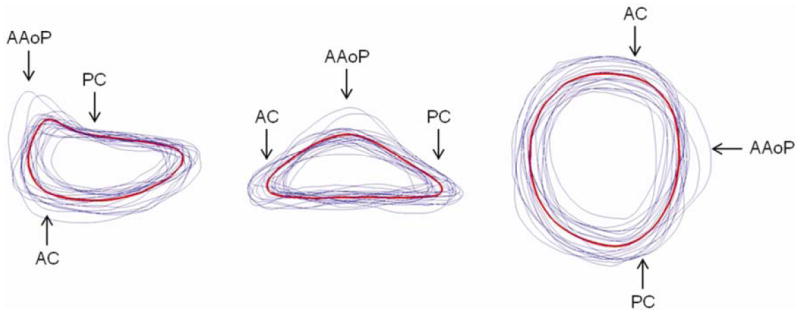
Mean (red) and individual (blue) 3D annular contours shown from three perspectives. (AAoP = anterior aortic peak, PC = posterior commissure, AC = anterior commissure)

Mean (red) and individual (blue) 3D annular contours shown from three perspectives. (AAoP = anterior aortic peak, PC = posterior commissure, AC = anterior commissure)