
Figure 3.
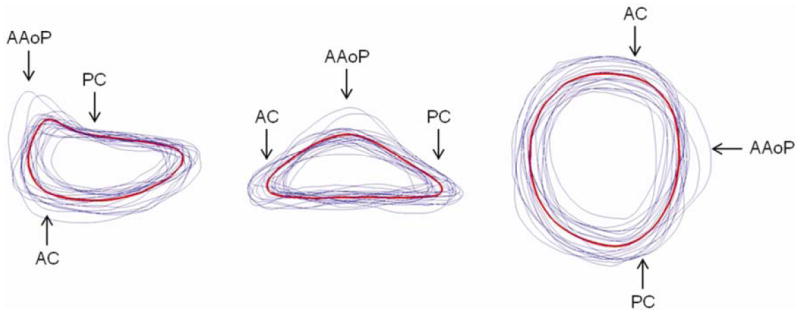
Mean (red) and individual (blue) 3D annular contours shown from three perspectives. (AAoP = anterior aortic peak, PC = posterior commissure, AC = anterior commissure)
Official websites use .gov
A
.gov website belongs to an official
government organization in the United States.
Secure .gov websites use HTTPS
A lock (
) or https:// means you've safely
connected to the .gov website. Share sensitive
information only on official, secure websites.
Mean (red) and individual (blue) 3D annular contours shown from three perspectives. (AAoP = anterior aortic peak, PC = posterior commissure, AC = anterior commissure)