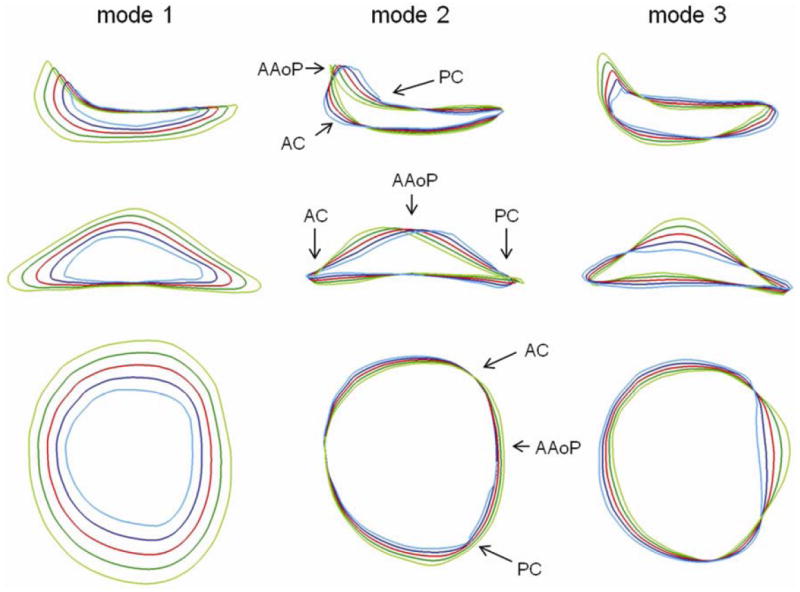
Figure 5.

Three modes of variation in normal annular geometry (columns), shown from three different viewpoints (rows). The red curve is the mean annular shape, the dark and light blue curves are +1 and +2 standard deviations from the mean, and the dark and light green curves are -1 and -2 standard deviations from the mean along a given mode of shape variation obtained by principal component analysis.
