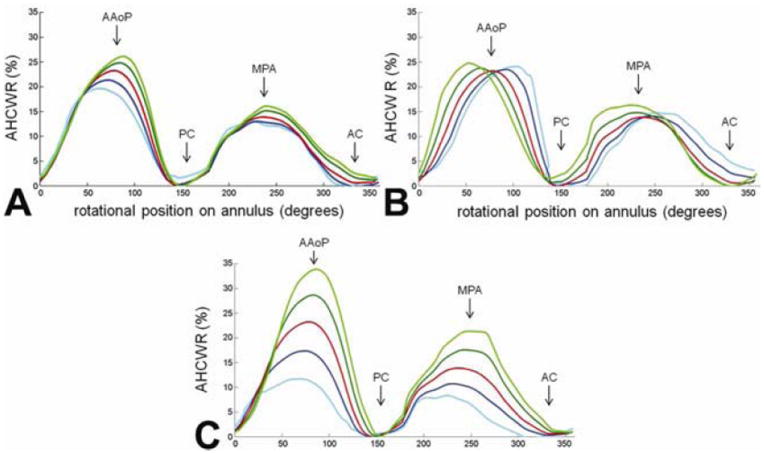
Figure 6.

Annular height to intercommissural width ratio (AHCWR) as a function of rotational position on the annular contour. Each plot refers to one of three eigenmodes in shape variation obtained by principal component analysis. The red curve refers to the mean annular contour, the dark and light blue curves refer to +1 and +2 standard deviations from the mean, and the dark and light green curves refer to -1 and -2 standard deviations from the mean along a given eigenmode of shape variation. A: mode 1; B: mode 2; C: mode 3. (AAoP = anterior aortic peak, PC = posterior commissure, MPA = midpoint of the posterior annulus, AC = anterior commissure)
