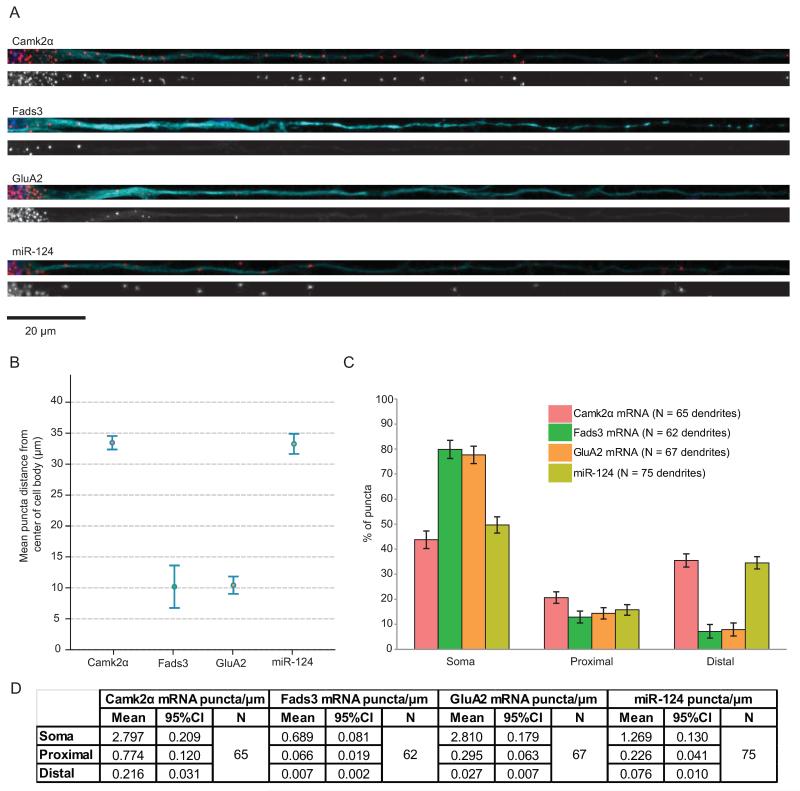
Figure 3.
GluA2 mRNA and miR-124 have different patterns of distribution.
(A) Representative fluorescence in situ hybridization (FISH) images of straightened dendrites. Top: red, FISH puncta; cyan, MAP2; blue, Hoechst. Bottom: FISH puncta in gray scale. Scale bar = 20 μm. (B) Group data for mean puncta distance from the center of the cell body. Error bars show 95% confidence intervals. (C) Puncta were classified into three subcompartments and the percentage of puncta in each subcompartment is shown. “Soma” represents the cell body; “proximal” represents from 0 to 20 μm from the cell body; and “distal” represents greater than 20 μm from the cell body. Error bars show 95% confidence intervals. (D) Table showing the absolute number of puncta per micron in each subcompartment, along with number of dendrites measured for each gene. Dendrites were imaged from 4 to 7 independent experiments.

