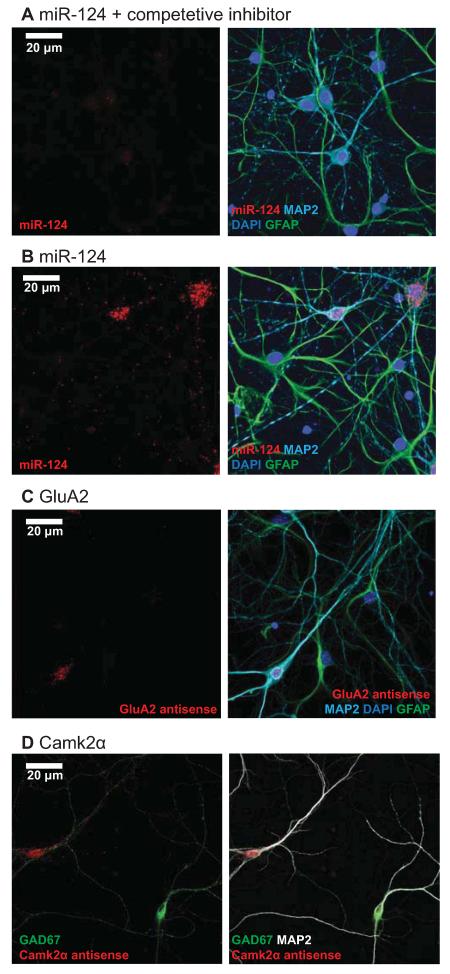
Figure 4.
Control experiments demonstrate the specificity of the FISH signals.
(A) miR-124 signal is drastically reduced in the presence of a fully complementary competitive inhibitor at 10X concentration. Red, miR-124; green, GFAP; cyan, MAP2; blue, Hoechst. Scale bar = 20 μm. (B) miR-124 signal is absent from astrocytes. Red, miR-124; green, GFAP; cyan, MAP2; blue, Hoechst. (C) GluA2 mRNA signal is absent from astrocytes. Red, GluA2 mRNA; green, GFAP; cyan, MAP2; blue, Hoechst. (D) Camk2α mRNA signal is absent from inhibitory neurons. Red, Camk2α mRNA; green, GAD67; white, MAP2.

