Figure 6.
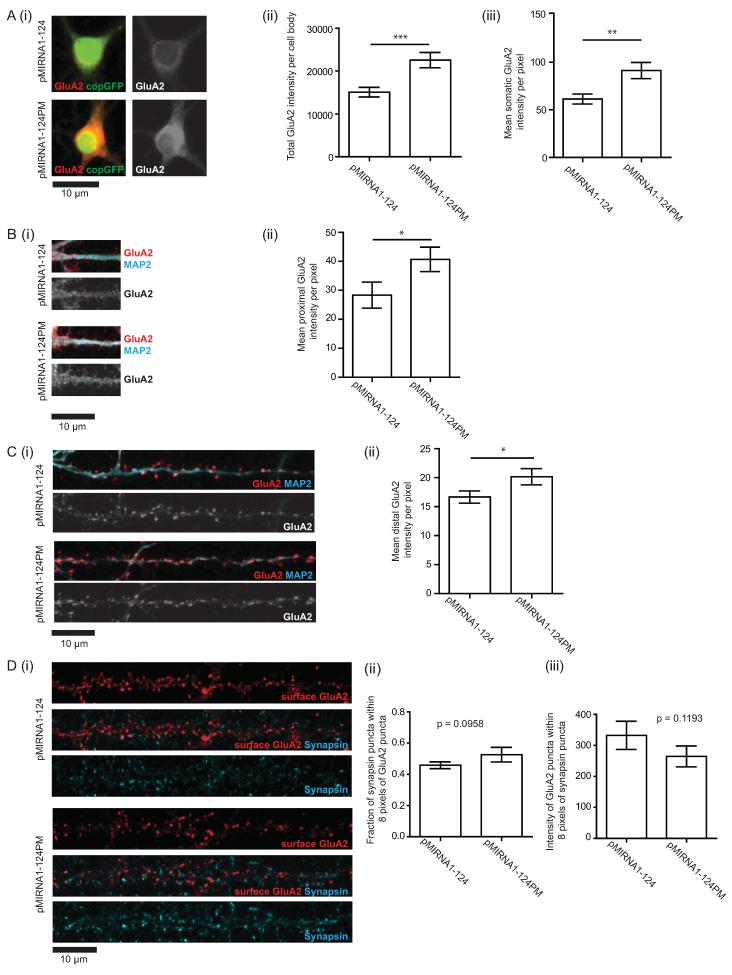
Overexpression of miR-124 down-regulates cytoplasmic but not synaptic GluA2 protein levels.
(A–C) Measurement of total GluA2 protein expression by immunocytochemistry (ICC). N = 5 independent experiments, 3 to 5 fields per experiment. Quantification of the cell body and dendritic signals were performed on the same neurons. (A) GluA2 expression in the cell body. (i) Representative images of cell bodies of transduced neurons. Red/grayscale, GluA2 protein; green, copGFP. (ii) Mean GluA2 intensity per pixel. (iii) GluA2 intensity per cell body. (B) GluA2 expression in proximal dendrites (i) Representative images. Red/grayscale, GluA2 protein; cyan, MAP2 (ii) Mean GluA2 intensity per pixel. (C) GluA2 expression distal dendrites (i) Representative images. Red/grayscale, GluA2 protein; cyan, MAP2 (ii) Mean GluA2 intensity per pixel. (D) Measurement of synaptic GluA2 protein expression by surface labeling of GluA2 in live neurons followed by fixation and staining for synapsin. (i) Representative images of surface expressed GluA2. Red, GluA2; cyan, synapsin. (ii) Fraction of synapsin puncta that appose GluA2 puncta. (iii) Integrated intensity of GluA2 puncta that appose synapsin puncta. N = 3 independent experiments, each with dendrites from 5 different neurons quantified. P values were determined by one-tailed t-tests. *P<0.05, **P<0.01, ***P<0.001. Error bars show S.E.M.

