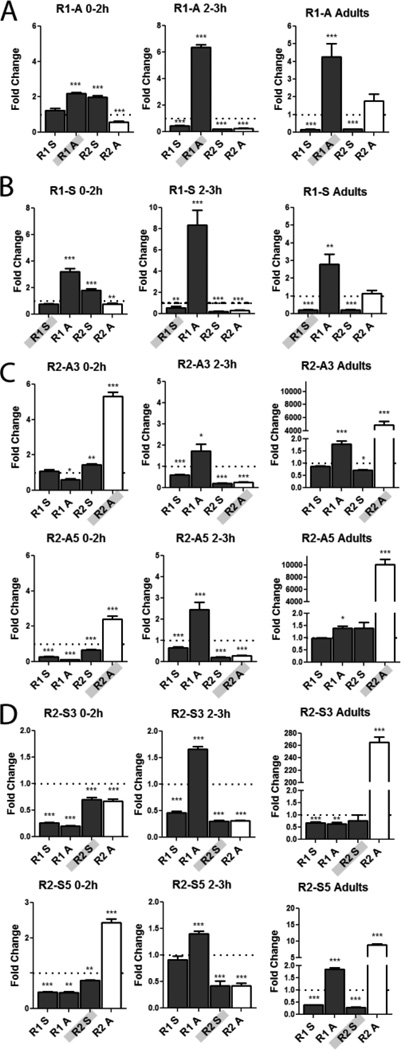
Figure 3. R1 and R2 lncRNAs interact and affect the levels of other lncRNAs.
All the lncRNAs change in levels when only one lncRNA is over-expressed. qRT-PCR of R1 and R2 transcripts was done in homozygous transgenic lines expressing each lncRNA. All data was normalized to tubulin and are reported as fold change relative to wild-type. Genotype and time window noted at top, lncRNA being expressed is shaded in grey on the X axis. Bars for the positively correlated lncRNA R2 antisense are shown in white, to facilitate tracking its relative levels. Quantitation of lncRNA levels in lines expressing transgene of R1A (A), R1S (B), two R2A lines (C) and two R2S lines (D). Note the y-axes have different scales. Error bars represent mean +/− SEM. * P-value <0.05, ** P-value <0.005, *** P-value <0.0005.

