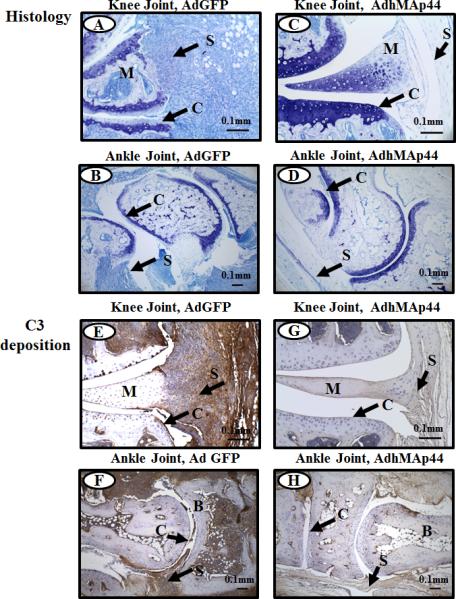
FIGURE 2.

Representative histopathology and C3 deposition images from the knee joints of WT mice treated with AdGFP or AdhMAp44 (HD). The top two panels from left to right (A & C) show staining with toluidine-blue (blue color) from the knee joints of WT mice treated with AdGFP (left panel) and AdhMAp44 (right panel). The second two panels from left to right (B & D) show staining with Toluidine-blue (blue color) from the ankle joints of WT mice treated with AdGFP (left panel) and AdhMAp44 (right panel). The third set of two panels from left to right (E & G) show staining with anti-C3 Ab (brown color) from the knee joints of WT mice treated with AdGFP (left panel) and AdhMAp44 (right panel). The fourth set of two panels from left to right (F & H) show staining with anti-C3 Ab (brown color) from the ankle joints of WT mice treated with AdGFP (left panel) and AdhMAp44 (right panel). Areas of synovium (S-black arrow), cartilage (C-black arrow), bone (B) and meniscus (M) are identified. Data from using a LD or a HD of AdhMAp44 in the study were indistinguishable; therefore, we show representative pictures from only the HD of AdhMAp44. Magnification for all knee joint images shown in Fig. 2 is 20X, and magnification for all ankle joints shown in Fig. 2 is 10X. Scale bar is 0.1mm (100μm).
