
FIGURE 5.
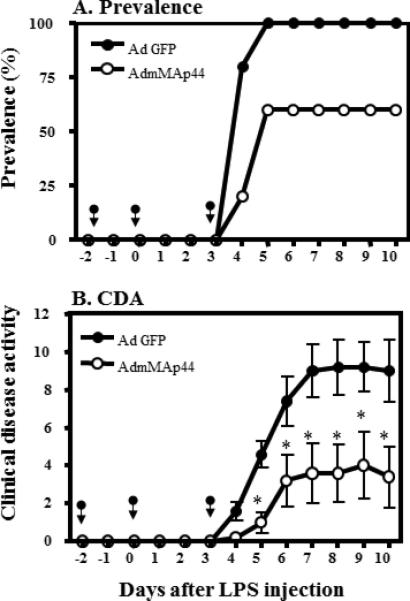
Effects of AdmMAp44 on CAIA. The data are derived from the indicated days after anti-CII mAb and LPS injections. The arrows in panels A and B indicate the days of injection of AdGFP or AdmMAp44. A. Prevalence of arthritis (%) over the duration of the experiment. B. CDA over the duration of the experiment. The data represent the mean ± SEM for each group (n = 5). *p < 0.05 in comparison to AdGFP treatment.