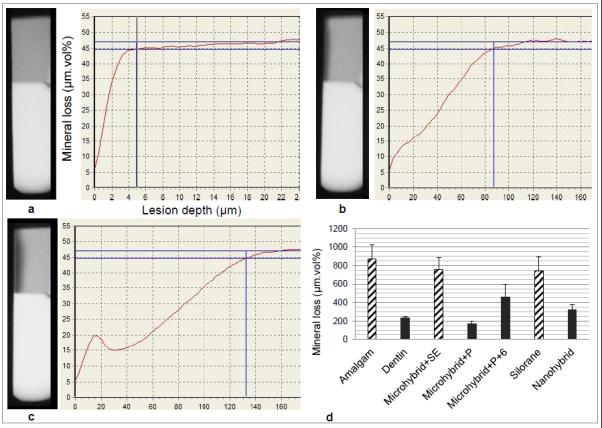
Fig. 2.

a-c: Examples of T-WIM radiographs of one sample (top half is dentine, bottom is composite) and resulting mineral profiles showing lesion progression baseline (a), 4 weeks (b) and 8 weeks (c); d: Average mineral loss values (and standard errors) for each group, with bar patterns indicating the statistical grouping according to the regression model and t tests (Table 2).
