
Figure 4.
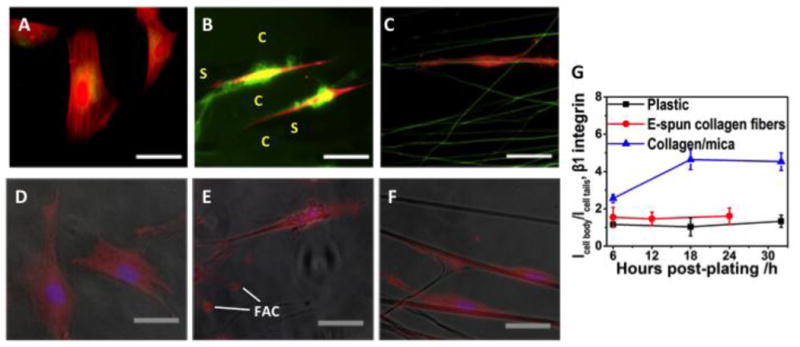
(A-C) Immunofluorescent images of typical hdpPSCs at 18 h post-plating on plastic (A), collagen/mica (B) and E-spun collagen fibers (C), staining against F-actin (red) and collagen (green). Bar size: 40 μm. (D-F) Overlay of optical and immunofluorescent images of hdpPSCs at 18 h post-plating on plastic (D), collagen/mica (E) and E-spun collagen fibers (F) staining against β-1 integrin (red) and DAPI (blue). Bar size: 30 μm. (G) ImageJ quantification of the ratio of β-1 integrin staining intensity at the cell body and at the cell tails, Icell body / Icell tails, for cells on various matrices.