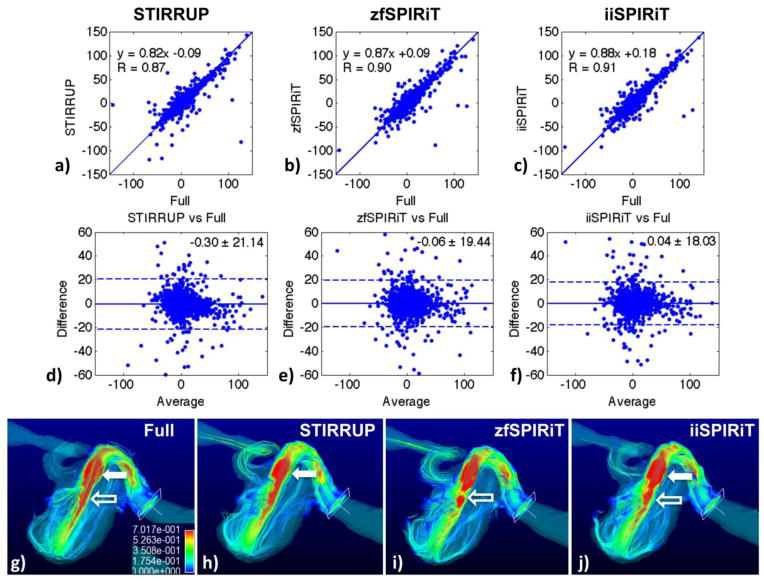
Figure 8.
Evaluation in a carotid aneurysm model. a–f) Linear regression and Bland-Altman plots of per-pixel flow velocities with different acceleration methods compared to the fully sampled data. g–j) show pathline visualization with the different methods. Compared to the reference (g), STIRRUP (h) has a visually smaller region of high velocities (solid arrow) that corresponds to the reduced flow velocities (underestimation), and zfSPIRiT has flow discontinuities (i, hollow arrow), while the iiSPIRiT result is closest to the reference.

