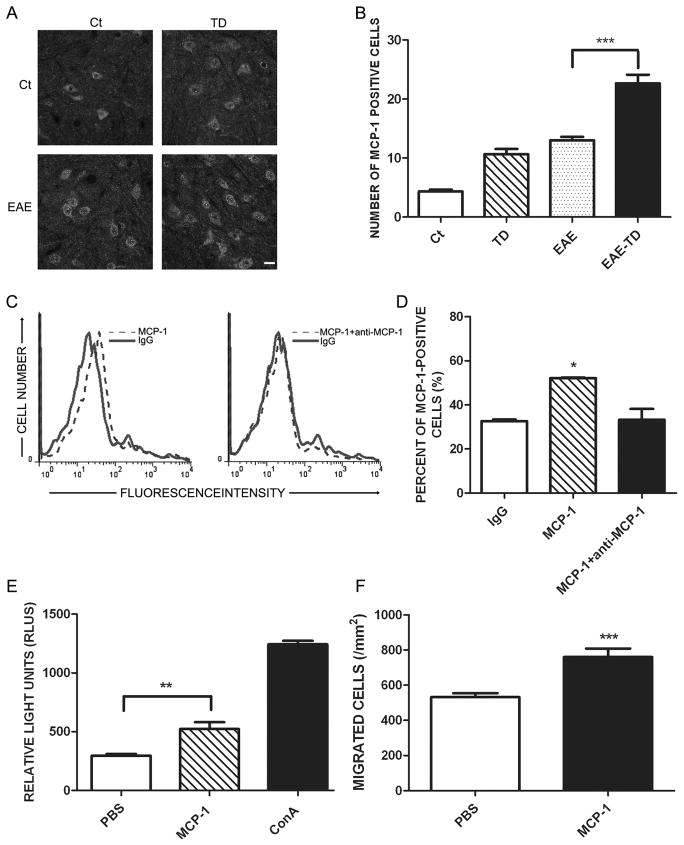
Figure 6. Effect of TD on the expression of CCL2 in spinal cord of EAE mice.
A: EAE was induced in C57BL/6 mice by injection of MOG35-55 with or without TD. The expression of CCL2 in the spinal cord was determined by IHC on day 20 after MOG35-55 injection. Bar = 20 μm. B: The number of CCL2-positive cells was quantified as described under the Materials and Methods. n = 5 for each group. C: Lymph node cells were isolated and incubated with CCL2 with/without anti-CCL2 antibody. The binding of CCL2 to T lymphocytes was evaluated by FACS. D: The binding of CCL2 to T lymphocytes was quantified by FlowJo software. E: Peripheral T lymphocytes were isolated from lymph nodes and treated with CCL2 (20 μg/ml) for 72 hours. Cell proliferation was determined using ViaLight Plus Kit. ConA was used as positive control for the stimulation of T cell proliferation. F: T cells were treated with CCL2 (5μg/ml) for 4 hours. CCL2-induced T-cell migration was measured by a Transwell Migration assay. Data were presented as mean ± SD; *p<0.05, **p<0.01, ***p<0.001, compared with control group. The experiment was replicated four times.

