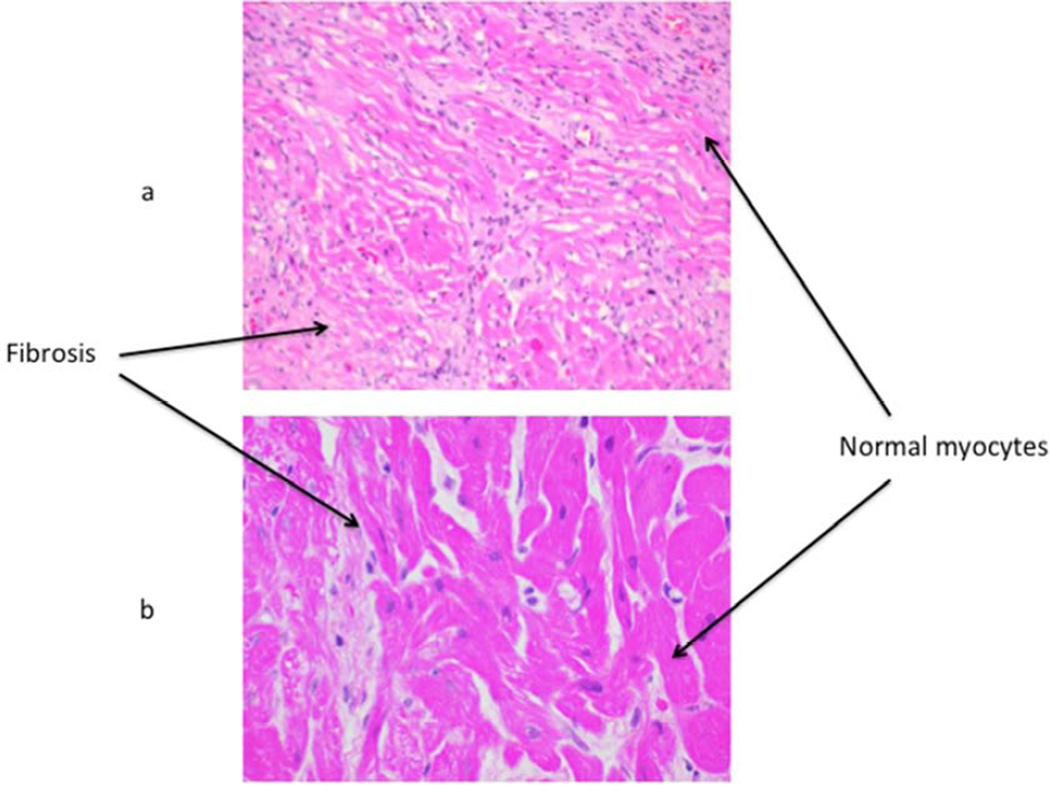
Figure 4.
Graft histology: H&E staining of a biopsy sample from one representative long term surviving graft each from group A (a) & D (b) is shown. Most of the group A graft shows fibrosis with some areas of normal myocytes, whereas mostly normal myocytes along with a small area of fibrosis is evident in group D.

