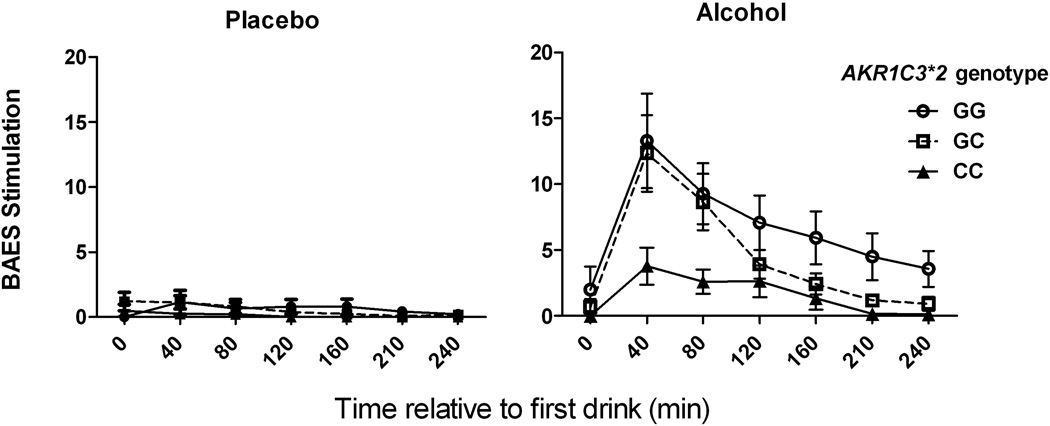
Fig. 2. Biphasic Alcohol Effects Scale (BAES) stimulation as a function of alcohol and AKR1C3*2 genotype.
Placebo beverage (left panel) and Alcohol (right panel) laboratory sessions. CC genotype subjects had lower self-reported levels of stimulation following alcohol than G-allele carriers. Data are displayed as mean ± S.E.M. of BAES stimulation score (sum of 7 items).

