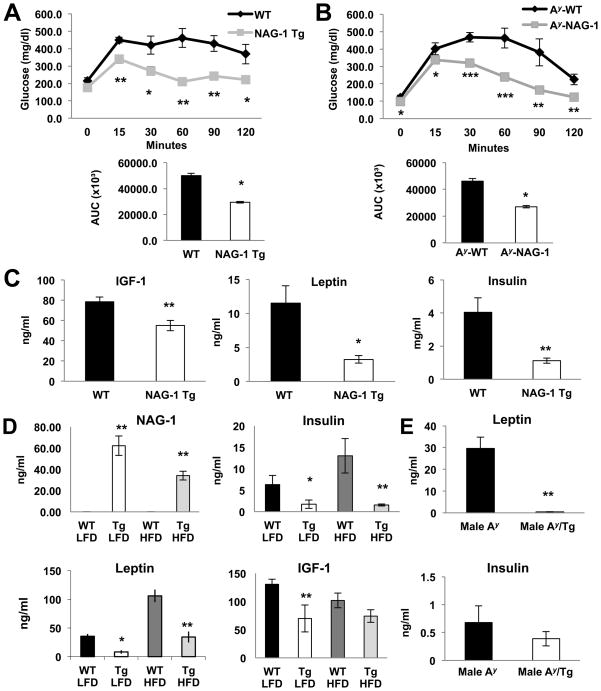
Figure 2. hNAG-1 mice have higher glucose tolerance.
Glucose tolerance test (A). hNAG-1 mice utilize glucose more efficiently than WT littermates over time (n=4 mice per group). (B) Ay/NAG-1 mice utilize glucose more efficiently compared to Ay mice (n=5–7 mice per group). (C–D) hNAG-1 mice have lower serum levels of insulin, leptin, and IGF-1 (n= 4–6 mice per group). (E) Serum leptin and insulin levels of Ay and Ay/NAG-1 mice (n=5–7 mice per group). Data are presented as ± SE. *p<0.05, **p<0.01, and ***p<0.001 as determined by Student’s t-test.

