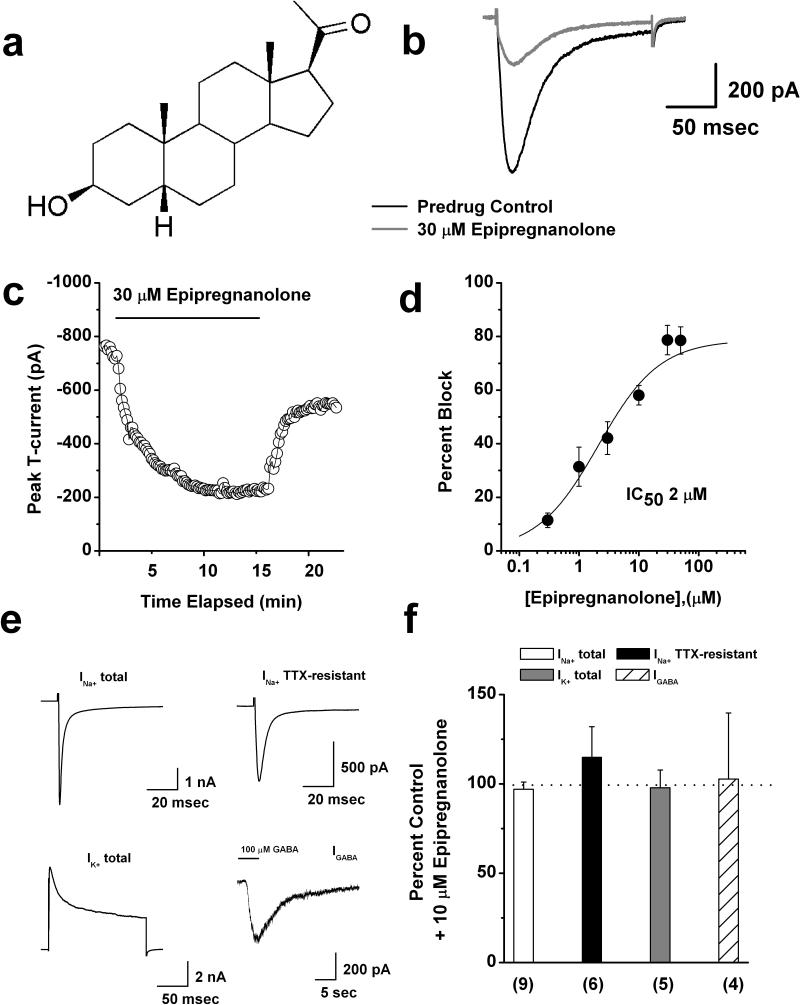
Figure 1. Concentration-dependent inhibition of rat DRG T-currents by epipregnanolone.
a: Scheme represents chemical structure of epipregnanonolone. b: Original traces show DRG T-currents in predrug control conditions (black trace) and after application of 30 μM epipregnanolone (gray trace). c: Time course of T-current inhibition by 30 μM epipregnanolone in the same representative DRG cell presented on panel b. d: Concentration-response relationship for epipregnanolone inhibition of T-current in rat DRG cells (n = 3-18 per data point). Solid line is the best fit (equation # 1, see Materials and Methods) yielding IC50 of 2.1 ± 0.5 μM, slope coefficient 0.8 ± 0.2, and maximal inhibition of 79 % of the peak of T-current. e: Original control current traces from different representative DRG cells show total Na+ current, TTX-resistant Na+ current, total K+ current, and GABA-gated currents. f: Bar graphs show average effects of 10 μM epipregnanolone upon different ionic currents in DRG cells as depicted on panel e of this figure. Dashed line indicates control predrug levels of currents. Number of cells per each experiment is indicated in parenthesis.

