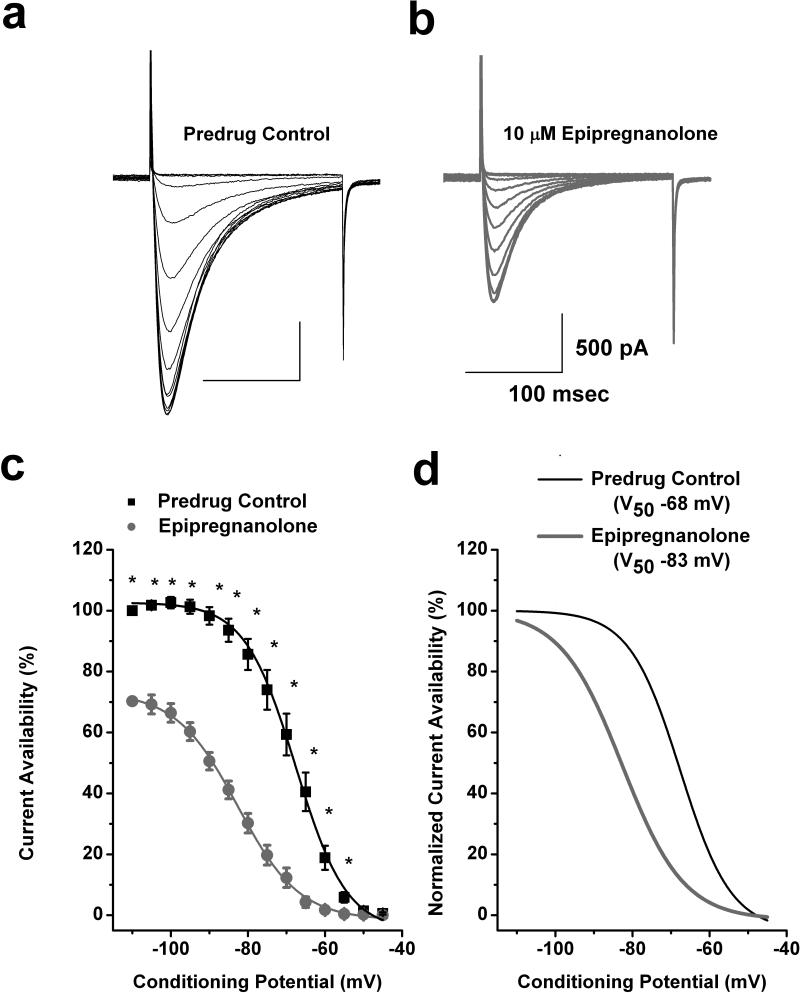
Figure 3. Epipregnanolone stabilizes inactive states of T-channels in rat DRG cells.
a,b: Representative original current traces of a T-rich DRG cell in control conditions (panel a) and after 5 minutes of bath application of 10 μM epipregnanolone (panel b). Calibration bars pertain to both panels. c: The average T-current steady-state inactivation curves from similar experiments shown in the upper panels of this figure (n = 14 cells). Black filled squares represent the control conditions; gray filled circles represent the conditions after bath applications of epipregnanolone in the same DRG cells. All points are normalized to maximal current at −110 mV in predrug control conditions. Solid lines are fitted using equation #2 (see Materials and Methods), giving half-maximal availability (V50), which occurred at −68 ± 1 mV with a slope k of 7 ± 1 mV in control conditions. V50 was −83 ± 1 mV with a slope k of 8 ± 1 mV in the conditions after epipregnanolone was applied. Symbol * indicates significance of p < 0.05. d: The same steady state-inactivation curves as depicted on panel c of this figure are normalized to its own maximal current. Solid black curve represent control conditions and gray solid curve reflects the hyperpolarizing shift of steady-state inactivation by 15 mV induced by epipregnanolone.

