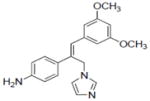
Table 1.
Resveratrol derivatives with pleiotropic mechanisms of action.a
| Compounds tested | NOb IC50 | Arom IC50 | NFκB IC50 | QR1c IR | QR1d CD | QR2 IC50 | ODC IC50 | DPPHe IC50 | ERα | ERβ | COX-1f IC50 | COX-2f IC50 | |
|---|---|---|---|---|---|---|---|---|---|---|---|---|---|
| 1 |

|
28.9±1.0 | 25±2.6 | 2.1±0.15 | 2.4±0.29 | 21±0.46 | 6.9±0.4 | 8.8±1.18 | 78.0±1.1 | 5.32 | 1.23 | 0.35±0.1 | 2.3±0.28 |
|
| |||||||||||||
| 2 |
|
3.7±0.9 | 22±0.54 | 0.9±0.23 | 2.6±0.17 | 6.5±0.24 | NTg | 18.1±2.1 | 147.9±0.3 | NAh | NA | 2.2±0.34 | 2.5±0.6 |
| 3 |

|
10.2±1.4 | 4.22±0.37 | 0.3±0.1 | NA | NA | NT | 6.4±0.8 | NA | NA | NA | 2.3±0.22 | NA |
| 4 |

|
NA | 0.31±0.09 | 0.3±0.15 | NA | NA | 9.0±0.5 | 5.2±1.4 | 258.0±1.0 | 2.82 | 2.06 | 0.61±.22 | 2.3±0.32 |
| 5 |

|
33.9±3.1 | 0.31±0.12 | 5.8±1.6 | 1.9±0.15 | NA | 1.7±0.06 | 1.3±0.4 | 227.7±0.5 | 1.65 | 1.33 | 0.76±0.14 | 12.4±5.1 |
| 6 |

|
4.6±0.5 | 0.9±0.17 | 0.9±0.3 | NA | NA | 0.27±0.01 | 13.1±2.6 | 101.3+0.9 | NA | NA | 1.4±0.11 | NA |
| 7 |

|
8.6±1.2 | 0.98±0.24 | 4.7±1.1 | NA | NA | NA | NA | 171.0±0.4 | 3.65 | 1.5 | 7.1±2.3 | NA |
| 8 |

|
8.3±1.3 | 0.04±0.01 | 15.9±3.1 | NA | NA | 18.3±1.6 | NA | NA | NA | NA | 1.5±0.28 | NA |
| 9 |

|
NA | 8.53±0.62 | 6.5±0.9 | NA | NA | 34 | 1.3±0.16 | 42.2±0.3 | 1.23 | 3.21 | 4.1±2.1 | NA |
| 10 |

|
NA | NA | 11.6±1.9 | NA | NA | NT | NA | 135.8±0.6 | NA | NA | 3.8±1.5 | NA |
| 11 |

|
14.7±2.7 | 2.42±0.37 | 17.3±3.1 | NA | NA | 1.5±0.07 | NA | 50.5±0.2 | 3.5 | 5.25 | 2.3±0.28 | NA |
| 12 |

|
31.2±2.0 | 2.83±0.25 | 0.5±0.2 | 2.8±0.16 | 5.6±0.26 | 14.9 | 12.4±1.9 | NA | NA | NA | 6.9±3.4 | NA |
| 13 |

|
16.6±3.8 | 8.49±0.48 | 0.3±0.15 | NA | NA | >50 | NA | 87.9±0.4 | NA | NA | 0.97±0.21 | NA |
| 14 |

|
NA | NA | 18.2±3.0 | NA | NA | NA | 0.7±0.12 | NA | NA | NA | 0.46±0.11 | NA |
| 15 |

|
32.2±0.4 | 2.80±0.19 | 4.7±1.1 | NA | NA | 33.8 | 4.2±0.9 | NA | NA | NA | 5.0±1.2 | NA |
| 16 |

|
11.7±1.9 | 4.30±0.47 | 0.2±0.11 | 2.3±0.12 | 45.8±0.87 | NT | 2.1±1.3 | NA | NA | NA | NA | NA |
| 17 |

|
7.2±0.6 | NA | 6.1±1.9 | 3.7±0.16 | 2.1±0.3 | NT | 12.3±2.4 | 80.7±0.3 | NA | NA | NA | NA |
| 18 |

|
NA | 1.8±0.22 | 4.9±0.72 | NA | NA | 2.5±0.2 | 0.9±0.3 | 88.6±12 | 2.7 | 1.98 | 5.3±1.4 | NA |
| 19 |

|
NA | 4.41±1.23 | 0.7±0.32 | NA | NA | 1.4±0.08 | NA | 54.4±8.2 | 2.17 | 2.91 | 1.1±0.05 | NA |
Compounds were classified as pleiotropic if activity was demonstrated in three or more of the assays; all IC50 values are in μM.
100% is with LPS as activator.
Induction ratio for treated vs. control cells.
Concentration to double the expression of QR1.
Sample concentration which caused 50% inhibition of DPPH, 100% activity is with scavenging DPPH free radical.
Concentration to inhibit COX-1 or -2 activity by 50%.
NT, not tested;
NA, not active, see Figure 1 for activity criteria.
