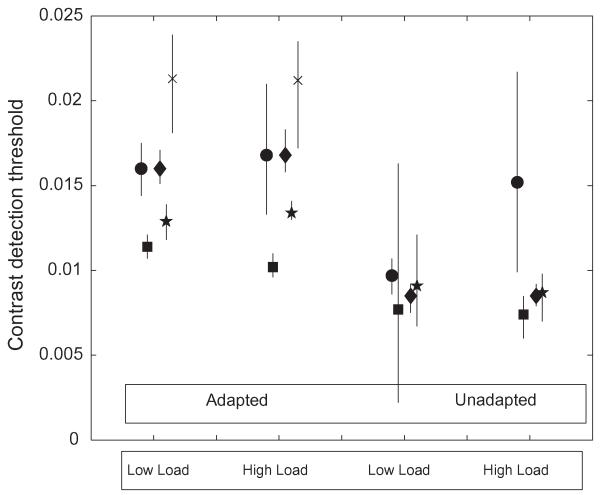
Fig. 1. The figure plots contrast detection thresholds (vertical axis; Michelson units) in four different conditions (labels on horizontal axis.).
Error bars show 95% confidence limits, based on 80 exact replications of the QUEST procedure in the experiment with the maximum-likelihood parameters of the psychometric function. Data for subjects MJM, MT, ABC, DEF and AT are shown with diamonds, stars, squares, circles and crosses respectively. Subject AT was not tested in the Diff (oppositely moving adaptor and test) condition.

