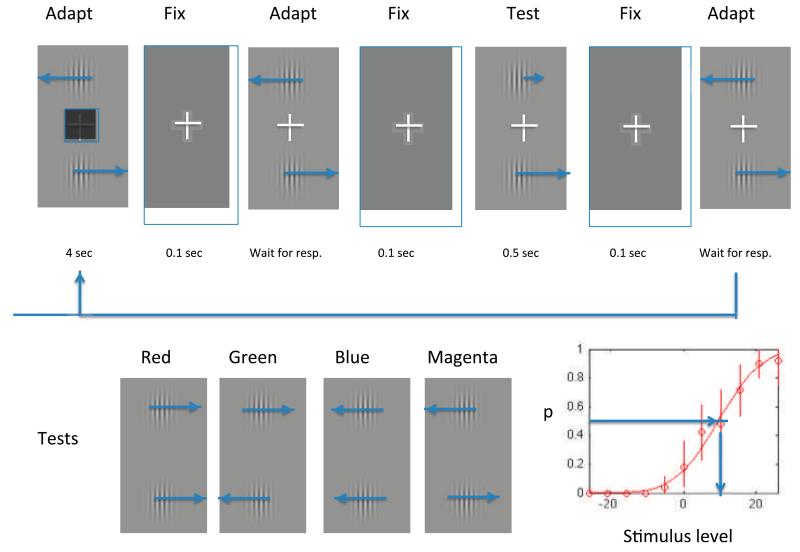
Figure 1.
The timeline at the top of the Figure shows the sequence of events in a single trial, which begins with a 4-s presentation of the adapting gratings during which the size of the black square in the center varies pseudorandomly over time, and subjects have to decide whether the average size on that trial is greater or smaller than a standard size. They indicate their decision by pressing either the up (greater) or down (smaller) arrow key on the keyboard, as soon as possible when the adapting gratings re-appear without the central square. Their key press triggers another 0.1-s blank interval followed by the test stimulus. The subject then makes a key press as quickly as possible to indicate which of the two stimuli (top or bottom) is moving more quickly, and their key press initiates the next trial. The lower half of the Figure shows the configurations of the test stimuli, which have all four possible combinations of direction in the top and bottom patches. In two of the tests (1 and 3) the patches move in the same direction and adaptation is expected to affect their perceived relative speed. In the other two tests (2 and 4) the stimuli move in opposite directions and adaptation is not expected to affect their relative speed. The Legend above each test shows the color in which the condition is coded in later Figures. The inset at the bottom right shows an illustrative psychometric function, from which the value of the mean (μ) is derived from the 0.5 point as shown, and the just-noticeable-difference is derived from the standard deviation (σ) of the best-fitting cumulative Gaussian function.

