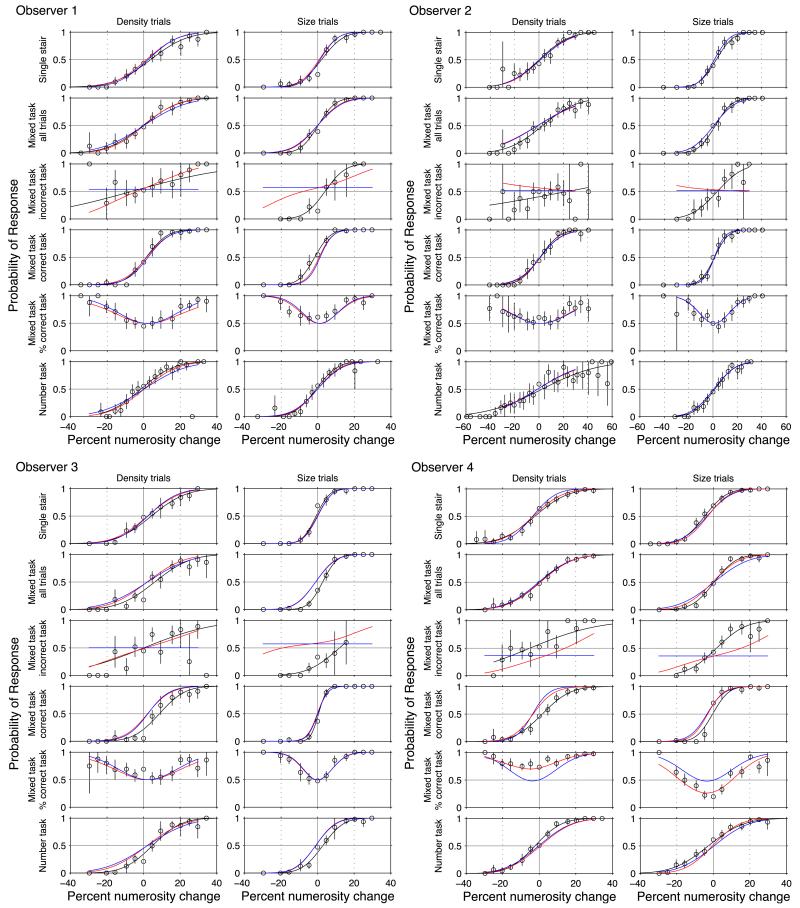
Figure 3. Each set of 12 panels shows the results from a different observer.
The vertical axis of the first four panel rows within each set show the probability of the response “denser” (left column)/“larger” (right column). The y-axis of the bottom-most panels depicts the probability of response “more.” Within each set, the top two panels show the psychometric functions of density-varying trials in the density task (left) and size-varying trials (right) in the size task. The panels in Rows 2 to 5 show the results on the mixed task when the size- and density-varying trials were randomly interleaved and the observer chose between four responses. Row 2 shows all trials under that condition. Row 3 shows the results when the observer chose the wrong task, for example, responded to density when the patches had a size difference. Row 4 shows results on trials when the observer chose the correct task. Row 5 shows the probability of correctly choosing the density task on density trials (left) and correctly choosing the size task on size trials (right). Row 6 shows the results of the numerosity task, when the density and size trials were randomly interleaved and the observer chose between two responses (“more” vs. “less”). The error bars show 95% confidence levels. The solid black curves depict two-parameter μ, σ fits to the individual psychometric functions (see Table 1). The blue curves show the best fits to all the data of the corresponding subject (including Row 5) of the four-parameter MAX model. The red curves for Observers 1 to 3 show the fit of a five-parameter model, identical to the four-parameter model but with the addition of a parameter accounting for the crossover between the size and density signals. The effect of the crossover parameter is evident in the slopes of the red curves in Row 3. The red curves for Observer 4 are the best fits of a six-parameter model that incorporates an additional sixth parameter accounting for the bias toward selecting the density response over the size response (Table 2).

