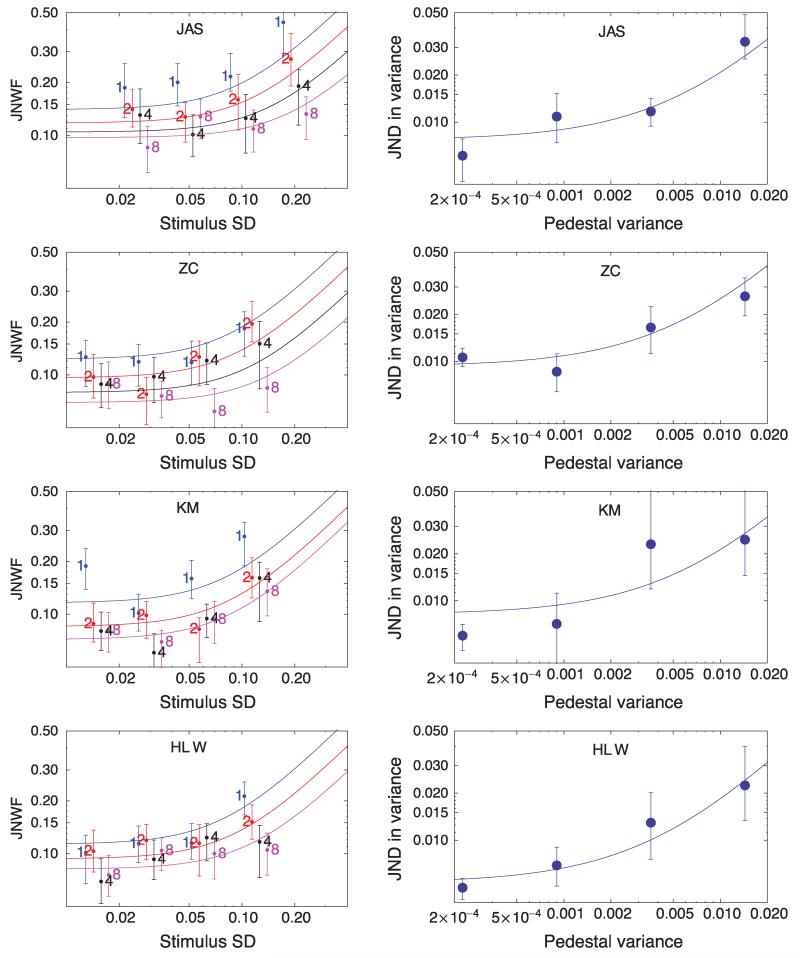
Figure 7. JNWFs between the (geometric) mean orientations (left) and just-noticeable differences (JNDs) in variance (right) of two successively displayed, uncrowded circle arrays.
SDs and variances, respectively, refer to parameters σC and of the lognormal distributions from which circle diameters were drawn. Numerals denote N, the number of circles per array. They have been nudged horizontally for better legibility. Error bars contain 95% confidence intervals. Blue, red, black, and magenta curves illustrate the best 3-parameter fit to the data on the left for N = 1, N = 2, N = 4, and N = 8, respectively. (Fits to N = 4 and N = 8 were identical for subject KM. They were also identical for HLW.) Simultaneous fits for variance discrimination, where N = 8, are shown on the right.

