Figure 2.

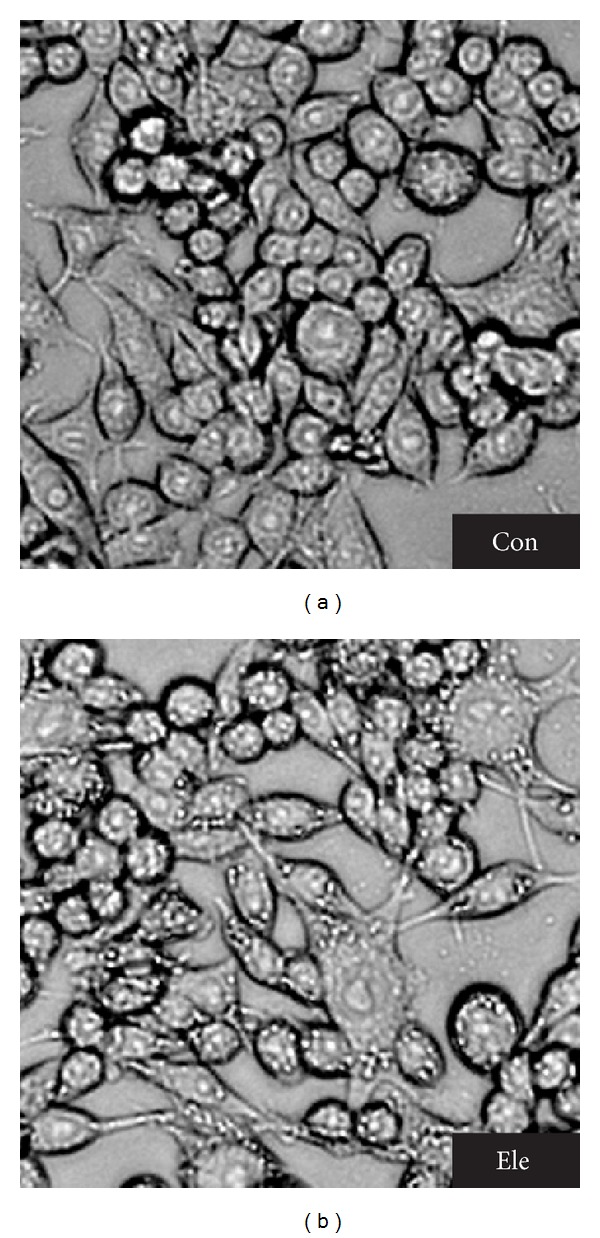
Cell morphological assessment. Light micrograph of HepG2 cells after overnight incubation with Ele. Compared to the control cells, cells exposed to Ele presented typical autophagy morphology with marketable vacuoles (×200).

Cell morphological assessment. Light micrograph of HepG2 cells after overnight incubation with Ele. Compared to the control cells, cells exposed to Ele presented typical autophagy morphology with marketable vacuoles (×200).