
Figure 5.
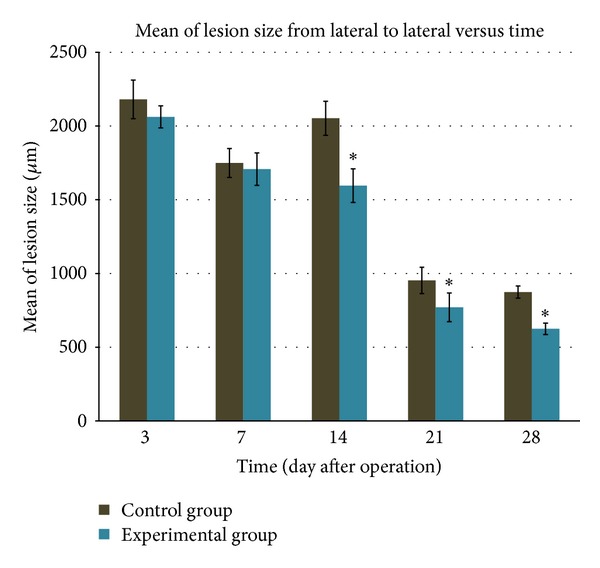
Difference in lesion size from lateral to lateral between animals without supplementation of S. platensis (control group) and animals supplemented with S. platensis (experimental group). The bar graphs indicate mean while the bars indicate SD of the measurement. ∗ P < 0.05 for experimental group versus control group.