
Figure 2.
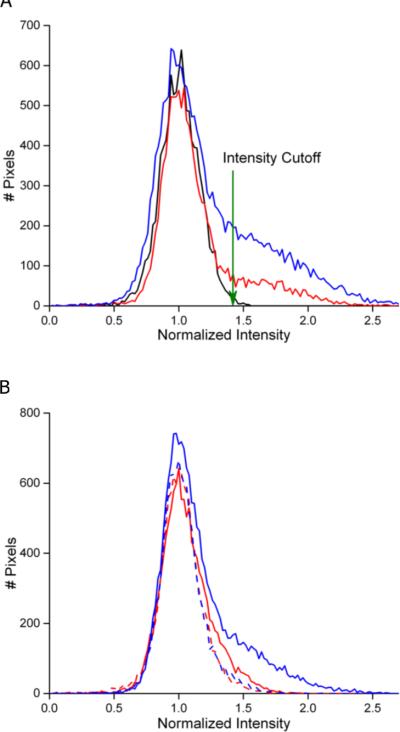
Histogram analysis enables quantitative MRI measurement of necrotic volume. (A) Image-pixel intensity histograms for the same non-Ab-treated mouse at 6 and 10 weeks following a single 60 Gy of radiation (red, blue) and average intensity histogram for 10 non-irradiated non-Ab-treated mice (black). The intensity cutoff used to define hyperintense pixels, corresponding to necrotic tissue, is indicated by the labeled arrow at a normalized intensity of 1.4. (B) Image-pixel intensity histograms for the same B20-4.1.1-treated (red) and bevacizumab-treated (blue) mice at 6 (dash line) and 10 (solid line) weeks following a single 60-Gy dose of radiation.