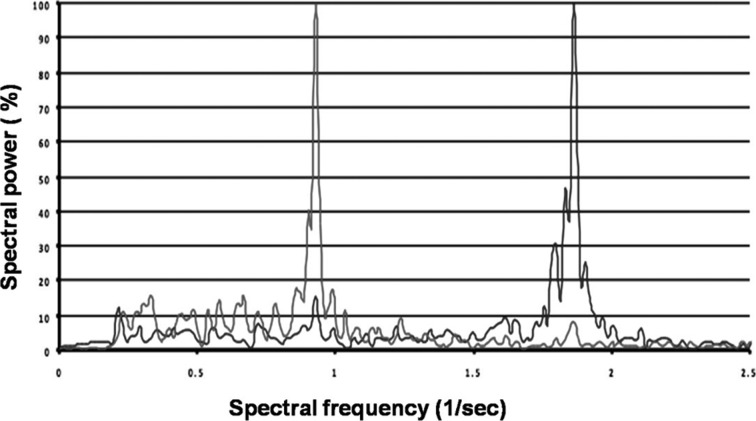
Fig. 3.
Spectral visualization of normal gait (control group, a 46-year-old male). The blue lines show 3D-accelerometer measurements in the anteroposterior direction, and the red lines show 3D-gyroscope measurements in the mediolateral direction. The plot shows two peaks, one each for gyroscope and accelerometry.

