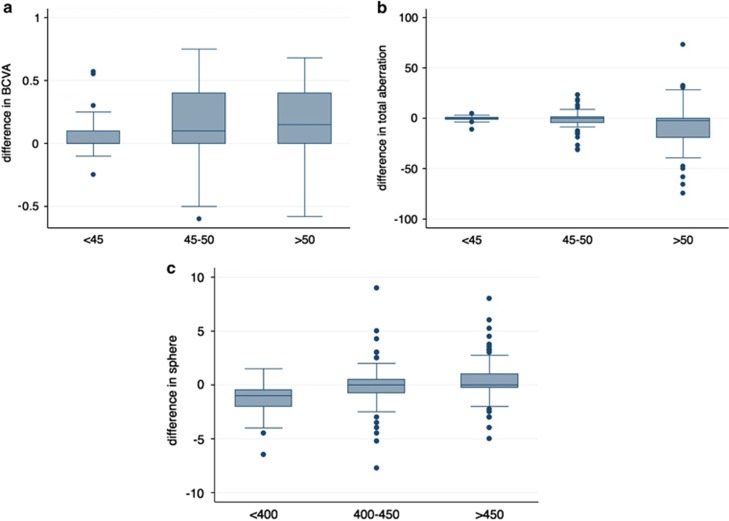
Figure 1.
Box and whisker plot between follow-up and preoperative values with respect to preoperative curvature (a and b) and thickness (c). Differences divided by preoperative Simk1 for best-corrected visual acuity (BCVA) are shown in graph a, for total aberration outcomes are shown in graph b. Changes in sphere divided by preoperative pachymetry are shown in graph c.

