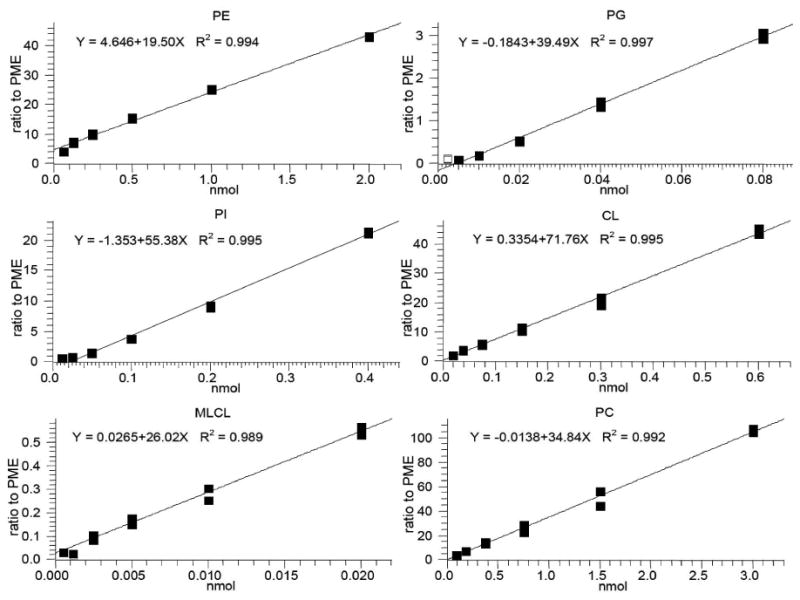
Figure 3.

Representative standard curves of six classes of phospholipids with PME as internal standard. Standardized phospholipids with six different concentrations were extracted and analyzed by HPLC-MS. Each data point represents the relative areas of chromatographic peaks of phospholipid compared to that of PME at a given concentration.
