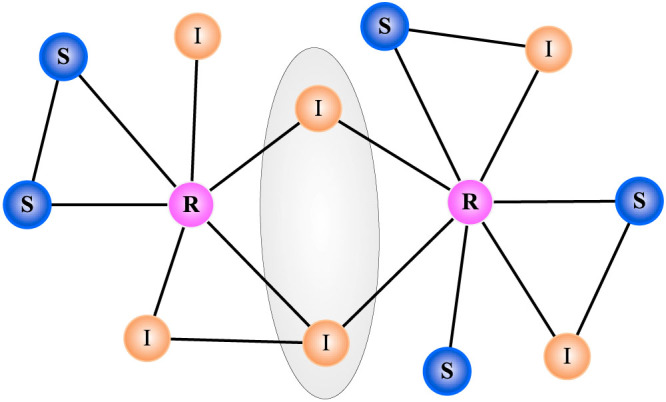
Figure 1. A snapshot of the spreading result in a toy network.

The blue nodes are susceptible (marked by S), yellow nodes are infected (marked by I) and pink nodes are recovered (marked by R). Since each node inside the shade ellipse is connecting to two R nodes, one cannot distinguish which R node actually infected these two I nodes in the previous step. In the benchmark method, these two I nodes will be used when estimating the infection probability based on each R node, which finally leads to an overestimation of the infection probability.
