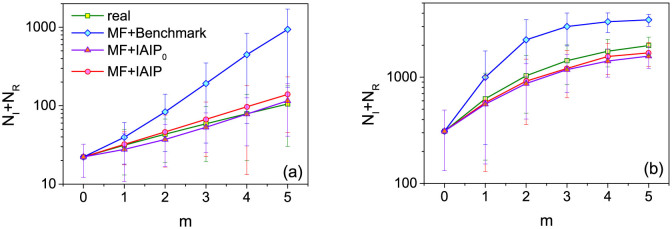
Figure 5. The predicted and real evolution of NI + NR in (a) WS and (b) BA networks.

The real infection probability is set as μr = 0.15. m is the number of spreading steps after the observed snapshot. The network parameters are the same as those in Fig. 2. The mean values and error bars are obtained by predicting the future spreading coverage under 100 spreading realizations from each node in the network.
