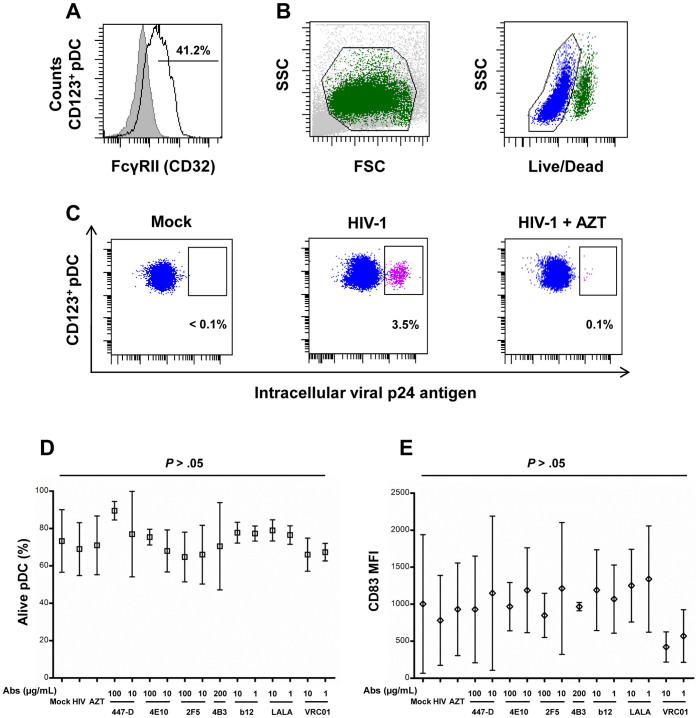
Figure 1. Primary pDC express FcγRII and are productively infected by HIV-1.
(A) The percentage of FcγRII-positive cells was determined in living CD123-positive pDC; isotype controls are in grey and FcγRII staining is the black line. (B) Dot plot representation of pDC analysis by flow cytometry. Events were sorted using forward and side scatter (B, left), doublet events were excluded and only living cells, selected by Live/Dead exclusion, were included in the analysis (B, right). (C) Productive infection was detected by intracellular immunolabeling of the p24 HIV antigen in living CD123-positive pDC (in blue). Dot plots show non-infected controls (Mock, left), HIV-1BaL replication (middle, in pink), and negative controls for HIV-1BaL replication with reverse transcriptase inhibitor AZT (5 µM) (right). (D) Viability of primary pDC during neutralization assay: primary pDC were stained with Live/Dead to ensure viability of the cells. Means of the percentage of alive CD123-positive cells is represented for non-infected control (Mock), HIV-1BaL infected cells (HIV), infected cells treated with the reverse transcriptase inhibitor AZT (5 µM), and cells were infected in the presence of various concentrations of anti-HIV Abs. (E) Maturation of primary pDC during neutralization assay: maturation of primary pDC was analyzed by CD83 labeling. Mean of the CD83 MFI (mean of fluorescence intensity) measured in each experiment is represented for pDC treated under the same conditions described in (D). One-way ANOVA showed no significant difference between these conditions. Data are means ± standard deviation (SD) of independent experiments performed with primary pDC from at least three different healthy donors. Groups were compared by one-way ANOVA (Kruskal-Wallis test), with P < .05 considered significant.

