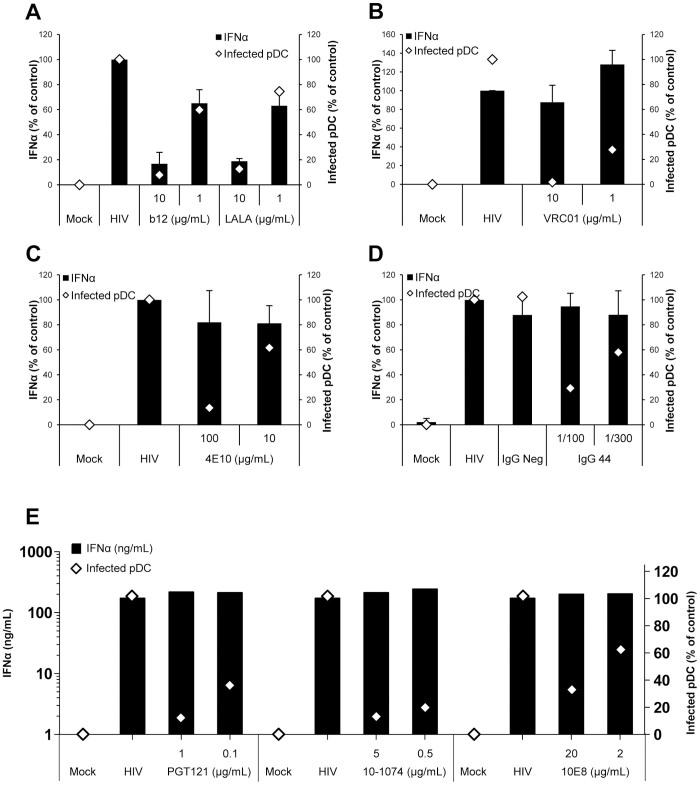
Figure 4. Production of IFN-α by primary pDC during neutralization assay.
The supernatants of pDC infected in the presence or absence of different Ab were collected at 48 h post-infection. Histograms represent the concentration of IFN-α detected in the supernatants (black bars, left axis) of pDC incubated alone (Mock) or with HIV-1BaL (HIV) or with HIV-1BaL in the presence of NAb b12 or LALA (A), VRC01 (B), 4E10 (C), IgG purified from serum of HIV-seronegative (IgG Neg) and HIV-1-posive (IgG44) individuals (D), and the most recent broadly NAb PGT121, 10-1074 and 10E8 (E). In parallel, the percentage of infected pDC in the presence of NAb compared to the control condition without NAb is shown (triangle, right axis). Data are means ± SD for IFN-α (ng/ml), representative of three independent experiments performed with primary pDC from three healthy blood donors.

