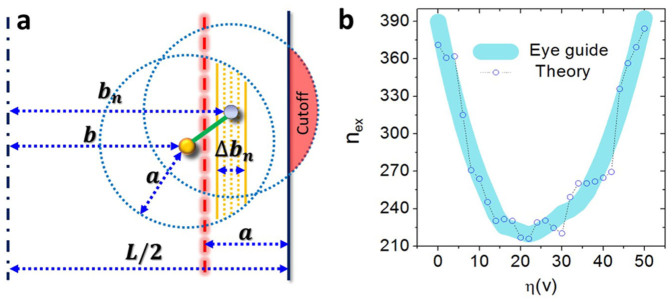
Figure 2. Geometrical setting and the theory result.

(a), Illustration of various geometrical quantities used in the analysis: communication radius a, distance b from the middle of the square to the target node, distance bn from the middle of the square to a neighbor of the target node, the width Δbn of the bar region, and the cutoff region of the communication circle. (b), Results of Eq. 2 for db = 0.01 and Δbn = 0.002 (the main features do not depend on the specific values of db and Δbn).
