
Fig. 1.
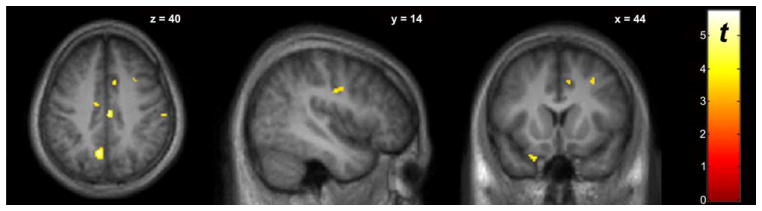
Whole-brain voxel-wise paired t-test comparing BPND between baseline “Go” and SST scan conditions (n=9). The “hot” colorscale indicates voxels where BPND, BL was significantly higher than BPND, SS (increased DA during SST). Display threshold P<0.005, uncorrected, k>10. Significant clusters are listed in Table II.