Figure 2.
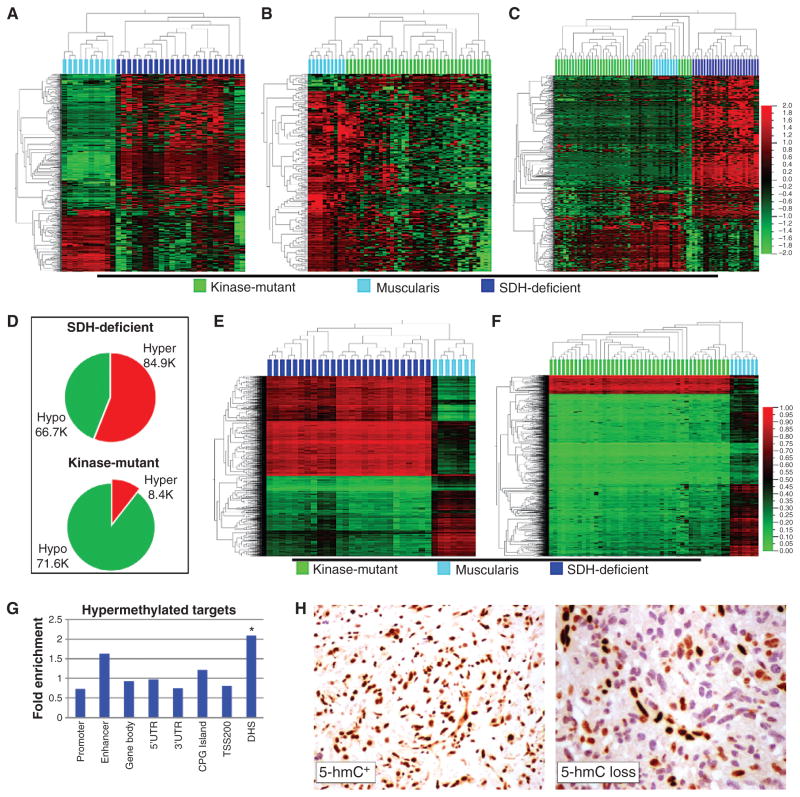
Visual display of the proportions of hyper- and hypomethylated differentially methylated targets (DMT) relative to reference muscularis tissue in SDH- versus kinase-mutant GIST. A, 2-D hierarchical clustering of 24 SDH-mutant GIST (dark blue) and 10 reference muscularis samples (cyan); CpG targets (y-axis) are filtered for significant DMT between the 2 sample groups (GoldenGate methylation assay, group delta β > 0.1 and P < 0.05, n = 666 targets). Of the DMT, 457 are hypermethylated and 209 are hypomethylated in SDH-mutant GIST. B, 2-D hierarchical clustering of 39 kinase-mutant GIST (green) and 10 reference baseline muscularis samples (cyan); CpG targets are filtered for significant DMT between the 2 sample groups (GoldenGate methylation assay, group delta β > 0.1 and P < 0.05, n = 222 targets). Of the DMT, 19 are hypermethylated, and 203 hypomethylated, in kinase-mutant GIST. C, 2-D hierarchical clustering of the union sets of all tissues [SDH-mutant GIST (n = 24), kinase-mutant GIST (n = 39), and reference muscularis (n = 10)] and DMT (n = 748 targets) from A and B. D, hyper- and hypomethylated DMT composition for SDH-deficient versus kinase-mutant GIST (Infinium 450 K methylation data). E, 2-D hierarchical clustering of SDH-deficient GIST (n = 26, dark blue) and reference muscularis tissues (n = 7, cyan) with Infinium 450 K methylation data; targets included on the y-axis are the top hyper- and hypomethylated DMT selected in proportion to their fraction of total DMT (DMT defined as group delta β > 0.1 and P < 0.05. Displayed on the heatmap is the union set of 1.7 K hyper- and 1.3 K hypomethylated DMT, which reflects their proportions of total DMT). F, 2-D hierarchical clustering of kinase-mutant GIST (n = 44, green) and reference muscularis tissues (n = 7, cyan) with Infinium 450 K methylation data; targets included on the y-axis are the top hyper- and hypomethylated DMT in proportion to their fraction of total DMT (DMT defined as group delta β > 0.1 and P < 0.05. Displayed on the heatmap is the union set of 0.3 K hyper- and 2.7 K hypomethylated DMT, which reflects their proportions of total DMT). G, fold enrichment of genomic annotations of hypermethylated targets in SDH-deficient GIST based on their proportion of all array targets. CpG target anatomic and functional annotations are according to the Illumina Infinium 450 K methylation assay manifest. * DNase hypersensitive site (DHS) is the only significantly enriched annotation (P = 0.0022) after Bonferroni correction. TSS200: within a distance of 200 bp of transcription start site. UTR, untranslated region. H, representative IHC results for 5-hmC+ (left) and 5-hmC loss in GIST tumors (right). Sixteen of 24 methyl-divergent GIST had 5-hmC loss, versus 1 of 12 methyl-centrist.

