Figure 4.
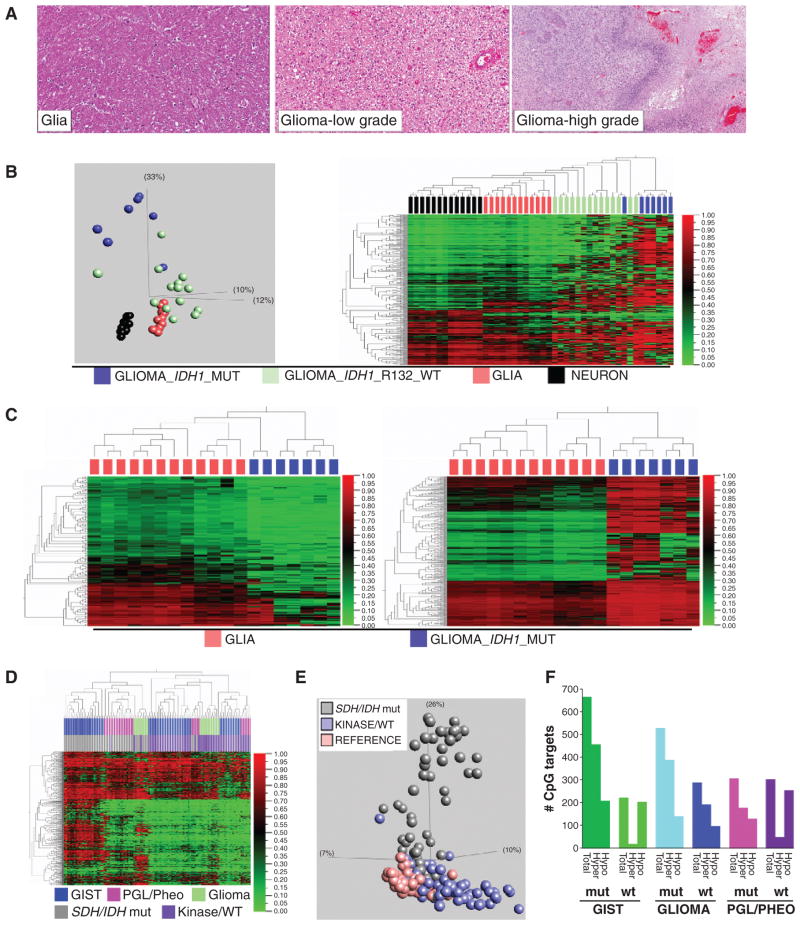
Comparison of isocitrate dehydrogenase (IDH)-mutant glioma with SDH-mutant GIST. A, histomorphology of high-grade glioma, low-grade glioma, and comparison reference glial tissue. (Reference neuronal tissue is previously shown in Fig. 1A.) B, left, PCA segregates glial neoplasms according to oncogenotype, and reveals greater divergence from baseline glia for IDH mutants. The plot includes 7 IDH1-mutant glial tumors, 20 IDH-wt glial tumors, and 12 glia and 13 neuronal reference tissues. The PCA plot data are 386 autosomal targets filtered for methylation β variance > 0.5 among the 46 samples (GoldenGate methylation data). Right: Unsupervised 2-D hierarchical clustering of the same data. C, left, hypomethylated DMT (group delta β > 0.1 and P < 0.05, n = 140 targets) identified in IDH-mutant glioma relative to reference glial tissue. Right, hypermethylated DMT (group delta β > 0.1 and P < 0.05, n = 388 targets) identified in IDH-mutant glioma relative to reference glial tissue (GoldenGate methylation data). D, unsupervised hierarchical clustering of all tumors in the study. Top colorbar: tumor type; bottom colorbar: oncogenotype. The y-axis data are 575 autosomal targets filtered for methylation β variance > 0.5 among the 113 samples. Oncogenotype drives higher level segregation. Also evident is the marked hypermethylation of SDH/IDH-mutant tumors of different lineage and anatomic sites. E, unsupervised PCA plot of 186 study samples annotated as normal tissue, SDH/IDH-mutant tumor, or SDH/IDH-wt/kinase-mutant tumor (var 0.5, 649 targets). F, quantities of significant hyper- and hypomethylated DMT in different tumor lineages as a function of mutant versus wt SDH/IDH status. mut, mutant; wt, wild-type.

