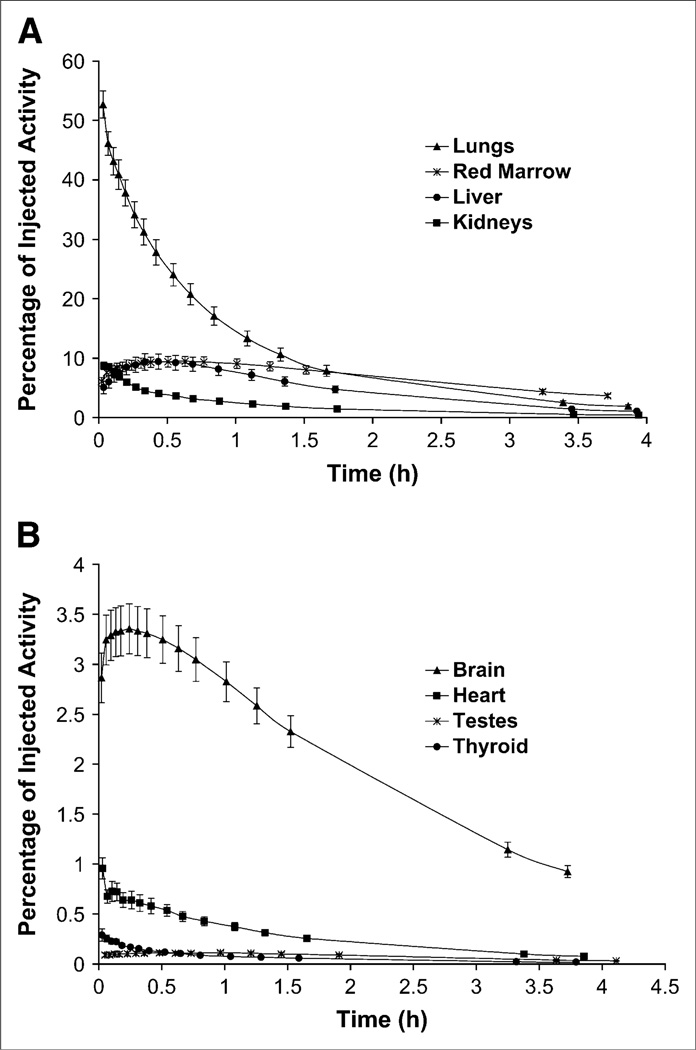
FIGURE 2.
(A and B) Time–activity curves for visually identifiable organs with both high (A) and low (B) uptake of activity after injection of [18F]SPA-RQ. Activity data were determined from analysis of thin-slice images and are expressed, without correction for radioactive decay, as mean ± SEM of 7 subjects.

