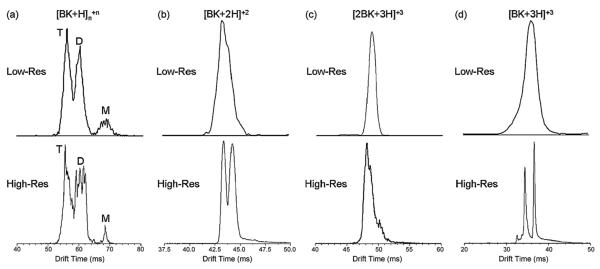
Fig. 18.

High-resolution IMS spectra of protonated bradykinin ions formed by ESI. Previous, lower resolution spectra are shown above. (a) z/n = +1, (b) z/n = +2, (c) z/n = +3/2, (d) z/n = +3, where z is the charge and n is the aggregate number (n = 1 is monomer, n = 2 is dimer, etc.). Reproduced from Ref. [125].
