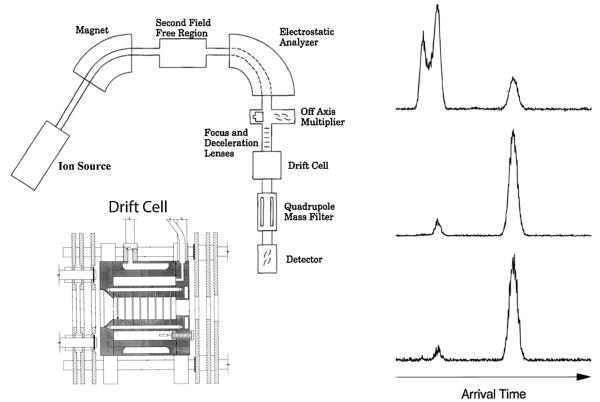
Fig. 3.
Left panel: At top a schematic of the overall instrument with the components labeled. At bottom a schematic of the temperature-dependent drift cell. Right panel: ATD for V+ atomic ions; top from electron impact on VCl4, middle from CID of VCl+ injected at high energy; bottom from VO+ injected at high energy. The peak at longest time in all cases corresponds to ground state 5D 3 (3d4), the doublet in the top ATD to 3F (3d34s1) and 5F (3d34s1) excited states and the shorter time peaks in the lower two ATDs to the 5F (3d34s1) excited state. Figure adapted in part from Refs. [13] and [37].

