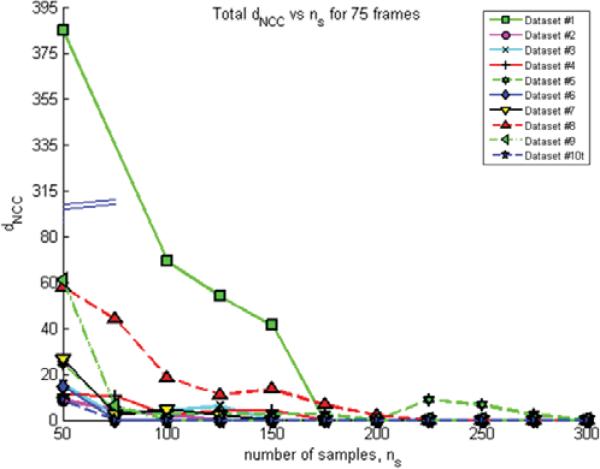
Figure 10.
This graph shows the number of samples, ns, being swept from 50 to 300 in increments of 25, versus dNCC values for each dataset. The specific value of ns that minimizes dNCC leads to successful motion correction, and this value of ns is the minimum number of samples per θj required to achieve the motion correction. From the graph, a value of ns = 200 is sufficient to perform motion correction on all the datasets presented.

