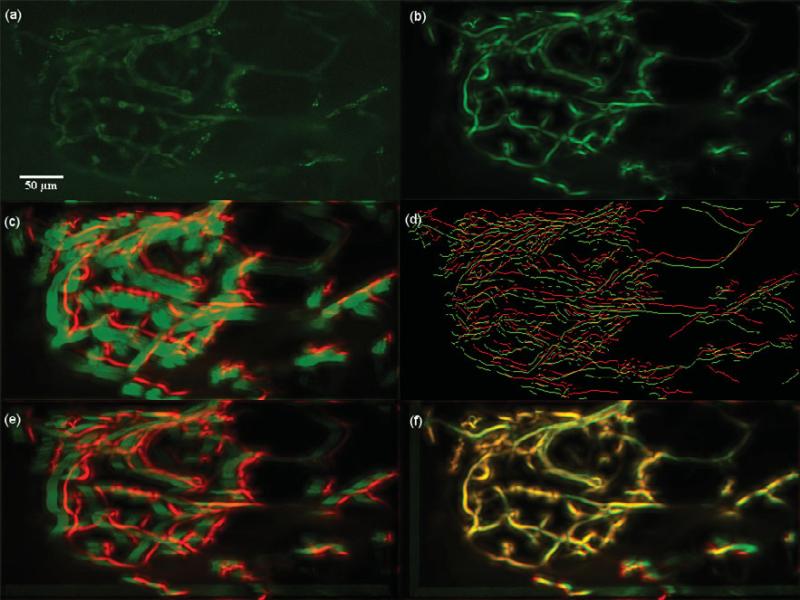
Figure 11.
Dataset 1, 375 frames, “most” movement at depth z0 = 11.625 μm. (a) A frame of the original t-stack. (b) The template used for performing motion correction. (c) The template (red channel) superimposed on the MIP (green channel) of the uncorrected t-stack. (d) Hysteresis results of the template superimposed with a frame of the uncorrected t-stack. (e) The template (red channel) superimposed on the MIP of the motion corrected t-stack (green channel) using the baseline algorithm. (f) The template (red channel) superimposed on the MIP of the motion corrected t-stack (green channel) using the presented algorithm; notice the near perfect overlap in yellow and the sharpness of all the vessels. The baseline is not able to correct the motion because of increased clutter of vasculature in panel e.

