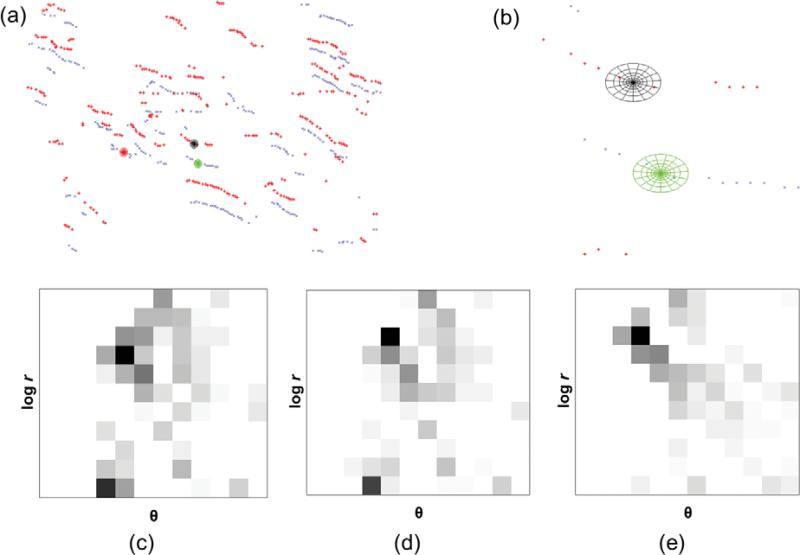
Figure 7.
(a) Sample points for one orientation, θj, for the template (in red) and a target frame from t-stack (in blue) and three log-polar histograms centered is shown, (b) zoomed in view of the log-polar histograms, black log-polar histogram belongs to the template, while the green and red log-polar histograms belong to the target frame, (c) the SC (dark = large value) for the black log-polar histogram, (d) the SC for the green log-polar histogram, and (e) the SC for the red log-polar histogram. The axes of the SCs are log(radius) versus θ. Note the similarity of the histograms of images c and d.

