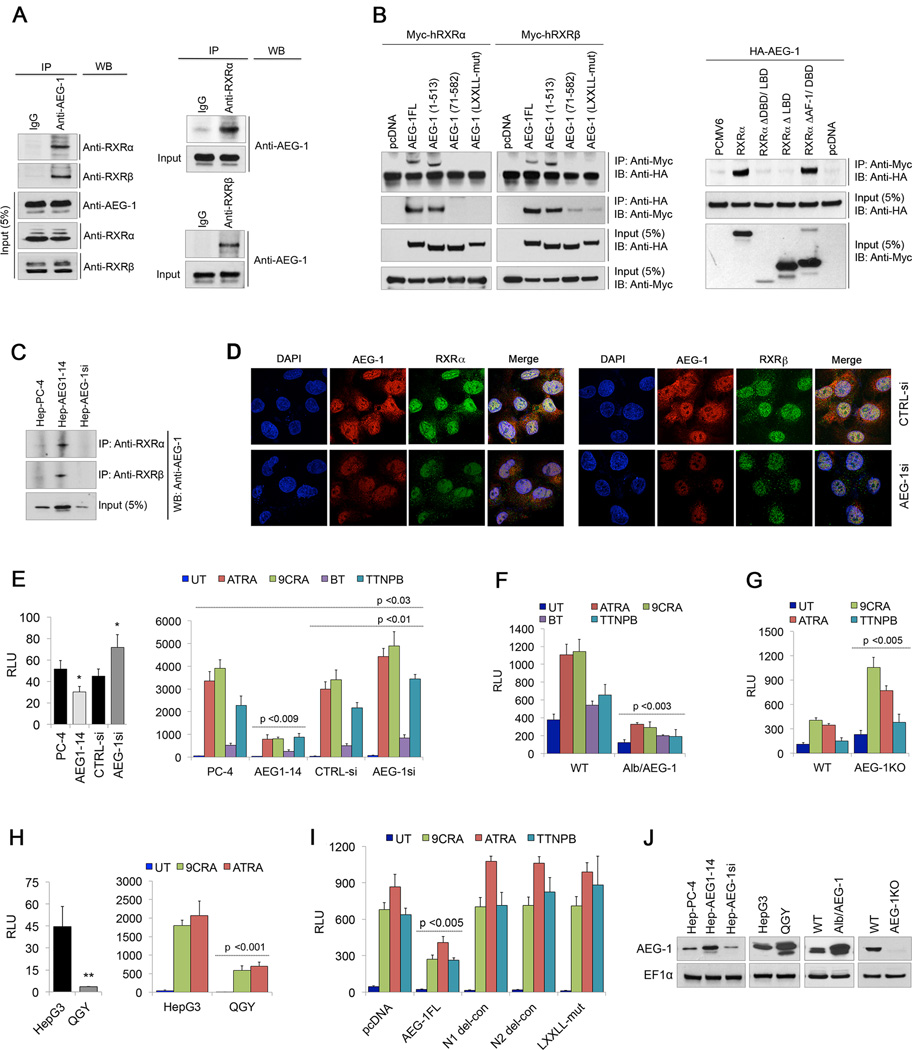
Fig. 1. AEG-1 interacts with RXRα and RXRβ abrogating RXR-dependent RARE promoter activity.
(A) Lysates from QGY-7703 cells were immunoprecipitated (IP) with anti-AEG-1 antibody and immunoblotted (IB or WB) with anti-RXRα and anti-RXRβ antibodies, and vice versa.
(B) HEK-293 cells were transiently transfected with Myc-tagged hRXRα or hRXRβ with control pcDNA3.1 vector, and HA-tagged full length AEG-1 (AEG-1FL, 1–582 a.a.), AEG-1 deletion constructs: C1 (1–513 a.a.) and N1 (71–582 a.a.), and AEG-1 LXXLL-mutant construct. After 48 hours, lysates were immunoprecipitated with anti-Myc antibody and IB conducted using anti-HA antibody, and vice versa. Cells were also transfected with HA-tagged AEG-1 with control PCMV6 vector, hRXRα (1–461 a.a.), RXRα deletion constructs: RXRαΔDBD/LBD (1–127 a.a.), RXRαΔLBD (1–208 a.a.) and RXRαΔAFD/DBD (226–461 a.a.). After 48 hours, lysates were immunoprecipitated using Myc and IB with HA antibodies, and vice versa. Long exposure of the blot showed non-specific bands in the lanes representing RXR deletion mutants which might be because of non-specific activity of the secondary antibody.
(C) Lysates from control HepG3 (Hep-PC-4), AEG-1-over-expressing (Hep-AEG-1–14) and AEG-1 knockdown (Hep-AEG-1si) clones were subjected to IP using anti-RXRα and anti-RXRβ antibodies, and IB with anti-AEG-1 antibody.
(D) Representative fluorescent confocal micrographs showing co-localization of AEG-1 and RXRα/ RXRβ in HepG3 cells transfected with control (CTRLsi) or AEG-1 (AEG-1si) siRNA.
(E–H) Cells were transfected with RARE luciferase reporter plasmid (RARE.Luc) and 48 hours post-transfection luciferase assay was performed. RARE activity was measured in untreated (UT) or upon treatment with 5µM ATRA, 2µM 9CRA, 400nm BT or 1µM TTNPB for 24 hours in PC-4, AEG1–14, CTRL-si and AEG-1si cells (E), WT and Alb/AEG-1 (F), WT vs AEG-1KO mice hepatocytes (G), and HepG3 vs. QGY7703 cells (H).
(I) RARE activity was measured 48 hours after co-transfection of pcDNA3.1, AEG-1FL, AEG-1 deletion mutants N1 and N2 (101–582), and AEG-1 LXXLL-mut constructs in HepG3 cells.
(J) Expression level of AEG-1 in different cells with AEG-1 over-expression or knockdown.
For A–C, five percent of cell lysates were used as inputs. For D–I, the luciferase data represents four different sets of mice respectively. All data represent mean ± SEM of three independent experiments with significant p-values denoted in the respective panels. *, p<0.05; **, p<0.001.

