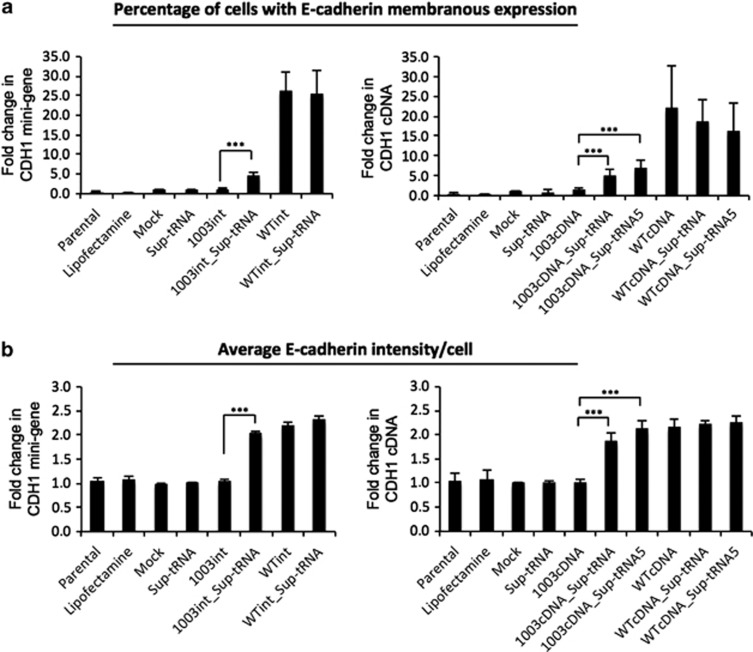
Figure 2.
Flow cytometry for transfected AGS cells. This analysis shows membranous E-cadherin expression in 1003int_sup-tRNAArg, WTint, 1003_cDNA_sup-tRNAArg, 1003_sup-tRNA5Arg and WTcDNA. (a) Graph bars for CDH1 mini-gene (left) and CDH1 cDNA (right) vectors are shown as percentage of membranous E-cadherin expressing cells (values normalized for Mock). (b) E-cadherin expression intensity in the analysed population, using geometric mean of population intensity parameter, was also analysed for CDH1 mini-gene (left) and CDH1 cDNA (right) vectors. The graphs show the mean±SD of at least four independent experiments. Statistical significance is depicted in graphs for P≤0.001 (***).

