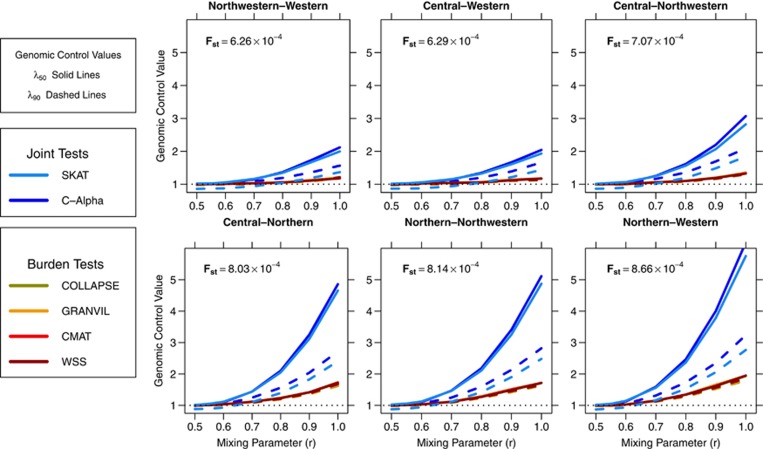
Figure 2.
Genomic control (GC) values for gene-based rare variant tests in structured European data sets. Median GC values (λ50, solid lines) and 90th percentile GC values (λ90, dashed lines) are shown at a range of mixing parameters (r) for each inter-European population comparison. For scenarios containing population structure (r>0.5), the joint tests (blue lines) consistently have higher λ50 values than the burden tests (red lines) in all population scenarios. In addition, λ90<<λ50 in many scenarios for the joint tests, indicating that inflation in the joint tests is not consistent across the P-value distribution.

