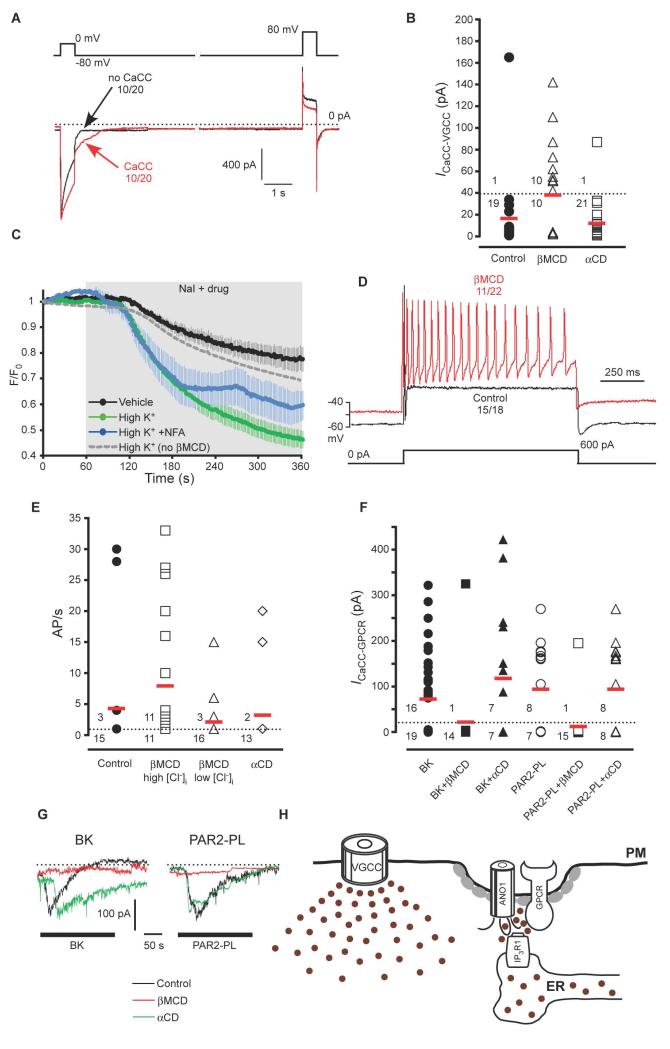
Fig. 7. Disruption of ANO1-containing complexes results in coupling of CaCC activity to ‘global’ Ca2+ elevations and overexcitable neurons.
(A) Whole cell patch-clamp experiments showing effect of treatment of cultured DRG neurons with 10 mM βMCD for 30 min on inward tail current. Voltage protocol and labelling as in Fig. 1A. (B) Summary for control, βMCD, and αCD (10 mM, 30 min) experiments like those shown in (A) for βMCD-treated neurons. ICaCC-VGCC was calculated as a difference in peak tail current amplitudes after the depolarizing pulses with and without Ca2+ influx; neurons were considered as not displaying activation of CaCC by VGCC when the resulting amplitude was below 40 pA. Red horizontal bars represent mean values of all neurons tested in each group. Numerals above and below the dotted line represent number of neurons with and without VGCC-induced CaCC, respectively. (C) Effect of βMCD treatment on I− influx induced by depolarization with 50 mM KCl in DRG neurons. Averaged time courses of normalized fluorescence (F/F0) of H148Q/I152L EYFP-transfected neurons perfused with 30 mM NaI-containing extracellular solution either alone (vehicle, n = 7) or in neurons treated with βMCD (10 mM, 30 min) and then stimulated with 50 mM KCl (High K+, n = 10) or 50 mM KCl and NFA (100 μm) (High K+ +NFA, n=5). The time of application of NaI and the depolarizing stimulus is indicated by the shaded area. Dotted grey line represent mean data for the effect of 50 mM KCl in control (βMCD untreated) neurons; taken from the Fig. 2B for comparison. (D) Current clamp experiments showing action potentials of control DRG neurons or neurons treated with βMCD in response to injection of a 600 pA depolarizing current pulse (depicted under the traces). (E) Summary for the experiments like those shown in (D); labelling as in (B) for neurons exposed to βMCD in the presence of high or low intracellular Cl− or in neurons exposed to αCD. (F) Summary of the effects of βMCD or αCD treatment on the GPCR-induced CaCC. (G) Exemplary current traces from the experiments summarized in (F). (H) Simplified scheme of the proposed juxtamembrane arrangements within an ANO1-containing signaling microdomain. Gray ovals represent Cav-1.

