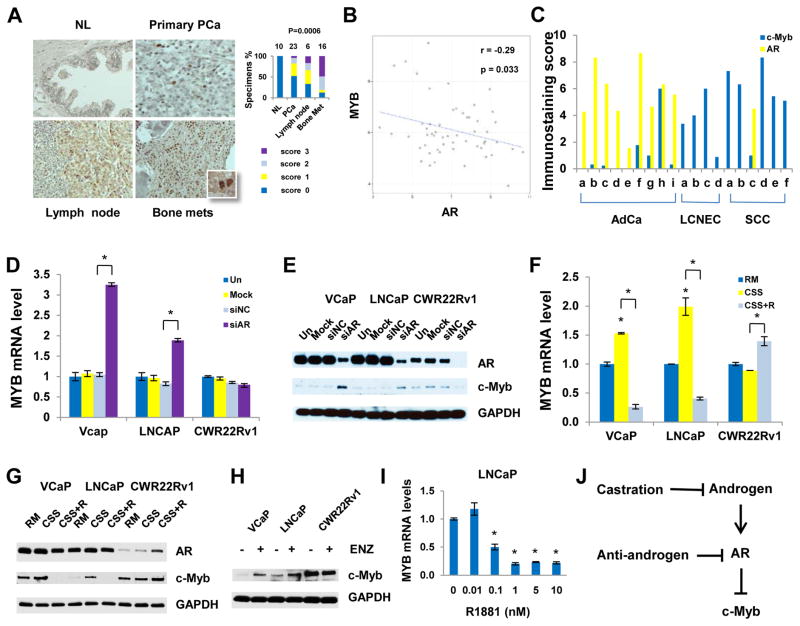
Fig. 1. Activation of c-Myb in CRPC and under experimental conditions that impair AR signaling.
(A) IHC analysis for expression of c-Myb in human PCa tissues. The numbers on the top of bar graphs denotes the number of specimens. P values were derived using Kruskal-Wallis rank testing. (B) Correlation analysis of MYB and AR mRNA expression in a published data set (GSE32269). (C) Human PCa xenograft tissue microarray. AdCa, adenocarcinoma; LCNEC, large cell neuroendocrine carcinoma; SCC, small cell prostate carcinoma. X axis labeling represent individual xenograft specimens. The information regarding patient derived xenografts is summarized in Table S2. (D and E) PCa cells were untreated, mock transfected or transfected with 20 nM siAR or negative control siRNA (siNC) for 48 hours. (D) qRT-PCR analysis (E) Western blotting analysis. (F and G) PCa cells were grown in regular medium (RM), charcoal-stripped serum medium (CSS) or CSS plus 10 nM R1881 (CSS+R) for 48 hours. (F) qRT-PCR analysis. (G) Western blotting analysis. (H) Western blotting analysis showing c-Myb abundances after the treatment of 1 μM enzalutamide (ENZ) for 48 hours. (I) qRT-PCR analysis 48 hours after R1818 treatment. (J) Summary of AR regulation of c-Myb. *P < 0.05.

